7. Debugging
Note that the usefulness and accuracy of the information within any debugger depends on your compilation options. If you have optimisation switched on then you may find that the line numbers listed in the debugging information do not correspond with the statements in your source code file. For debugging code we always recommend that you compile with optimisation switched off and the -g flag enabled to provide the most accurate information.
7.1 Available Debuggers
The Cray XE system comes with a number of tools to aid in debugging your program. HECToR has Cray ATP, Totalview, DDT and lgdb installed.
7.2 Totalview
Cray XE Totalview provides source-level debugging of Fortran, C, and C++ code compiled by the Cray, PGI and GNU compilers. The debugging tool provide both a command line interface and a Motif-based GUI. It supports MPI message queue display and watchpoints.
7.2.1 Example, Debugging an MPI application
The following example shows how to invoke Totalview to debug an MPI code.
- Start an X-server on your local machine (if you need to).
- Login to system using ssh -Y to enable X-windows forwarding.
- Compile your code with -g option. Your code and executable must be in the "work" directory
- Submit the Totalview job to the batch system and leave the terminal you submitted the job from open. Below is an example Totalview job submission script.
#!/bin/sh
#PBS -A your_budget_account
#PBS -l walltime=00:05:00
#PBS -v DISPLAY
#PBS -l mppwidth=64
#PBS -l mppnppn=32

# Make sure any symbolic links are resolved to absolute path
export PBS_O_WORKDIR=$(readlink -f $PBS_O_WORKDIR)

cd $PBS_O_WORKDIR

totalview aprun -a -b -a xt -n 64 -N 32 /work/.../myprog.x
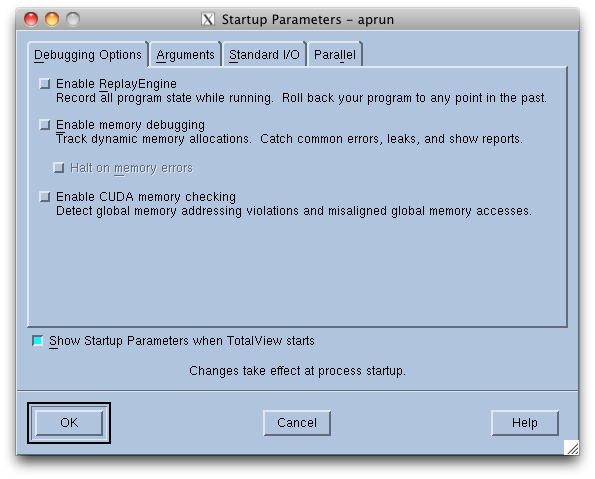
- When the job starts, the following dialogue will be displayed - click 'OK':
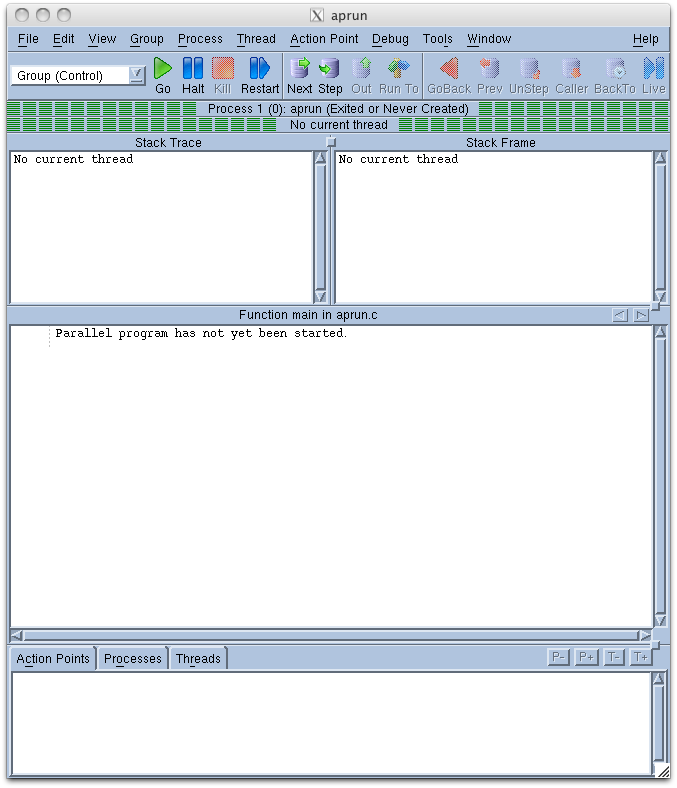
- An empty Totalview debugging will be displayed - click 'Go' to start the program:
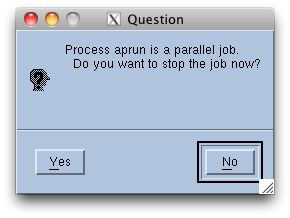
- The following dialogue will be displayed - click 'Yes' to begin debugging
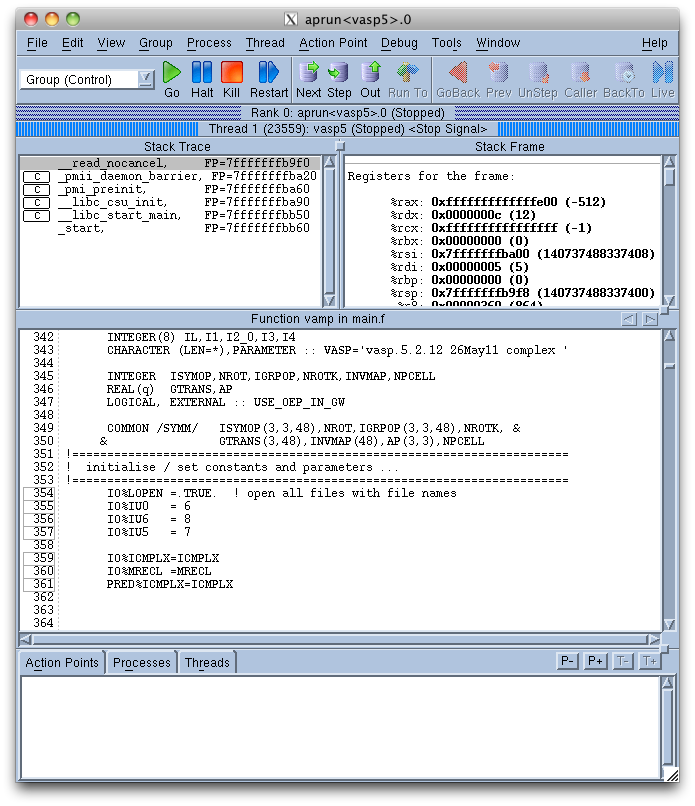
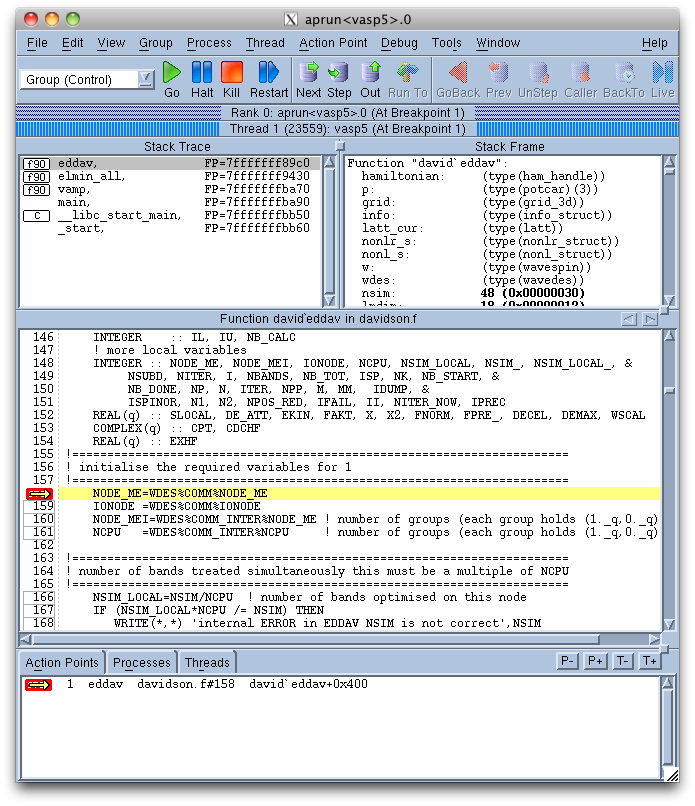
- The Totalview debugging window will be displayed with your source code in the middle window. The top-right frame shows the current call tree and the top-left frame shows the current values of defined variables.
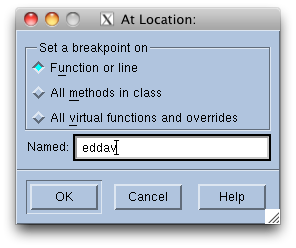
- To add a breakpoint at a particular subroutine or function select 'Debug -> Breakpoint -> At Location…' and enter the name of the subroutine or function and click 'OK':
- Click 'Go' in the Totalview debugging window and the program will run until the named routine is reached:
- You can add further breakpoints by scrolling through the source and clicking on the line number to the left of the source code.
7.2.2 Example: Using Totalview to debug a core file
To generate core files you just need your working directory to be in the "work" filesystem, and have the line:
ulimit -c unlimited
in your batch script. Unfortunately the option to tag core files with the process ID is not enabled so if more then one processor dumps core then the core files will overwrite each other.
To use the Totalview GUI to debug a core file, follow these steps.
Start an X Server on your local machine and login to HECToR using the '-Y' option to ssh. Launch Totalview :
totalview
The ''New Program window displays.
Click the down arrow on the field showing Start a new process, and from the drop-down list select "Open a core file". The Program and Core file fields display.
In the Program field, enter the name of the program you wish to debug. In the Core file field, enter the name of the core file produced by this program. If necessary, use the Browse functions to find and select the files.
Click the "OK" button. Totalview opens the executable and core files.
Alternately, you can use the command-line interface (CLI) to debug the program by entering the following command:
totalviewcli program_name core_file_name
7.2.3 Totalview Limitations for the HECToR system
The Totalview debugging suite for the Cray XE differs in functionality from the standard Totalview implementation in the following ways:
- The Totalview Visualizer is not included.
- The Totalview HyperHelp browser is not included.
- Debugging multiple threads on compute nodes is not supported.
- Debugging MPI_Spawn(), OpenMP, Cray SHMEM, or PVM programs is not supported.
- Compiled EVAL points and expressions are not supported.
- Type transformations for the PGI C++ compiler standard template library collection classes are not supported.
- Exception handling for the PGI C++ compiler runtime library is not supported.
- Spawning a process onto the compute processors is not supported.
- Machine partitioning schemes, gang scheduling, or batch systems are not supported.
In some cases, Totalview functionality is limited because Compute Node Linux (CNL) does not support the feature in the user program.
7.2.4 Viewing memory statistics using MemoryScape
Totalview comes with an optional application for viewing memory statistics called MemoryScape. To use MemoryScape you should add the following to your link line:
-L/opt/toolworks/totalview.8.11.0-0/linux-x86-64/lib -ltvheap_cnl_static
Then you must select the radio button "Enable Memory Debugging" at the start of your job. To view memory statistics select Debug and then Open MemoryScape. A new window will appear with a number of options for viewing different aspects of memory usage.
7.3 Cray ATP
Cray ATP (Abnormal Termination Processing) is a tool that monitors your application and, in the event of an abnormal termination, it will collate the failure information from all the running processes into files for analysis.
With ATP enabled, in the event of abnormal termination, all of the stacktraces are gathered from the dying processes, analysed and collated into a single file called atpMergedBT.dot. In addition the stacktrace from the first process to die (hence the probable cause for the failure) is delivered to stderr.
The atpMergedBT.dot file can be viewed using the stat command that is accessible by loading the stat module.
7.3.1 ATP Example
To enable ATP you should load the atp module in your job submission script and set the "ATP_ENABLED" environment variable to 1. i.e. you should include the following commands in your (bash) job submission script:
module load atp
export ATP_ENABLED=1
and then run your job using aprun as usual. Once your application has terminated abnormally you need to log into the service while exporting the X display back to your local machine (you must have an X server running locally) with:
ssh -Y username@hector.ac.uk
Load the stat module with:
module add stat
and view the merged stacktrace with:
stat atpMergedBT.dot
The stderr from your job should also contain useful information that has been processed by ATP.
7.4 GDB (GNU Debugger)
The standard GNU debugger: GDB is available on Cray XE systems. The debugger currently only supports the command line interface.
There are two components that you must use to debug your parallel program using GDB:
- The 'lgdb' program which launchers gdbserver processes on the login nodes.
- The 'gdb' program which connects to the remote program instances (started using 'lgdb') and provides the debugging command line interface.
When you execute your program using 'lgdb' the system will provide instructions on how to connect to the gdbserver process to debug your program. If your site does not support interactive access (i.e. you can only execute jobs parallel jobs in job submission scripts) then you must remember to redirect STDOUT from the gdbserver process to a file you can access while the job is running so that you have access to the information needed to connect gdb to the gdbserver. By default, on many Cray XE systems, the output from STDOUT is only delivered once the job is completed. See the example below for details on this.
7.4.1 Launching your program using 'lgdb'
The 'lgdb' command is used to launch your program and attach a gdbserver process to enable debugging. If you are running interactively, then the syntax for launching a 64 task job and debugging parallel process 0 would be:
lgdb --pes=0 --command="aprun -n 64 -N 32 my_parallel_program.x"
This command will yield instructions on how to connect the 'gdb' process that will look something like:
user@login1:/work/user/debug> less stdout.txt
sending /opt/cray/xt-tools/lgdb/1.4/xt/x86_64-unknown-linux-gnu/bin/lgdbd... completed
sending /opt/cray/xt-tools/lgdb/1.4/xt/x86_64-unknown-linux-gnu/bin/gdbserver... completed

*** create a new window and load the correct lgdb module for each target
*** run gdb from the following path:
/opt/cray/xt-tools/lgdb/1.4/xt/x86_64-unknown-linux-gnu/bin/gdb [PATH-TO-YOUR-APPLICATION]

*** the following gdb target commands should be used in separate windows
*** [Pe=0] to debug this Pe type the following in gdb
target remote nid00003:10000
If you do not have access to interactive access and need to run in batch mode then you simply replace the normal aprun command in your job submission script with the call to 'lgdb' and redirect STDOUT to a file. For example:
lgdb --pes=0 --command="aprun -n 64 -N 32 my_parallel_program.x" > stdout.txt
You must redirect STDOUT to a file in this way so you can access the information printed above on how to connect to the gdbserver from the 'gdb' program.
7.4.2 Debugging the remote gdbserver using 'gdb'
Once you have your compute process running with an associated gdbserver using the 'lgdb' command as specified above then you can start the GNU debugger on the command line on the login node with a command such as:
user@login1:/work/user/debug> \\
  /opt/cray/xt-tools/lgdb/1.4/xt/x86_64-unknown-linux-gnu/bin/gdb my_parallel_program.x
This will give you the '(gdb)' prompt where you can enter the command to link to the gdbserver process to start debugging. For example:
(gdb) target remote nid00003:10000
Now you can use gdb in the same way as you would if you were debugging a local program.
7.4.3 Useful GDB commands
Please see the documentation for GNU debugger documentation for a full list of the gdb commands. Some of the most often used commands are listed below.
Note: that pressing 'ctrl-c' with the program running while in GDB will cause the program to halt and print a backtrace. You can use this to identify problematic areas of the code.
- break function_name - (or b) insert breakpoint at start of specified function
- break file:/line_number/ - insert breakpoint at line number in specified file
- continue - (or c) continue runnning program until next breakpoint is reached
- next - (or n) step to next line of program (will also step into subroutines)
- list - (or l) list source code around current position
- list start_line,/end_line/ - list source code from start_line to end_line in current function.
- print variable_name - (or p) print the value of the specified variable
- print array_name/(/index) - print value at specified index of 1D array
- print array_name/(/index1,/index2/) - print value at specified index of 2D array
- print array_name/(/index)@/elements/ - print elements values from the array starting at index.
- ptype variable_name - print information on the variable type and array dimensions (if this is an array).
- quit - (or q) quit gdb and halt the running program.
7.4.4 Example: debugging an MPI program using GDB
This example illustrates the debugging of the VASP 5 code.
First, you must compile your program with debugging symbols (-g flag). You should also usually ensure that optimisation is turned off (-O0 flag) so that reordering of source code lines does not take place. (Of course, it may sometimes be necessary to include optimisation if this is the cause of the problems.)
In this example we will assume that you are running without interactive access to the compute nodes. Write a job submission script for your job in the usual way but with the following changes: you should load the 'xt-lgdb' module and you replace the standard aprun line with a call to 'lgdb' that contains your aprun command and which redirects STDOUT. For example:
#!/bin/bash --login
#PBS -N vasp_debug

# Number of MPI processes
#PBS -l mppwidth=64
#PBS -l mppnppn=32

# Walltime for the debug job
#PBS -l walltime=1:0:0

# Your account code
#PBS -A z01

# Add the Cray GDB module
module add xt-lgdb

# Location of the VASP 5 executable
export VASP_EXEDIR=/work/user/software/VASP/bin

# Make sure any symbolic links are resolved to absolute path
export PBS_O_WORKDIR=$(readlink -f $PBS_O_WORKDIR)

# Change to the directiry the job was submitted from
cd $PBS_O_WORKDIR

# Start the gdbserver with our parallel job.
#   We make sure we redirect STDOUT (to stdout.txt) so we can access
#    the information needed to attach to the remote gdbserver
#   We also use the --pes=0 option to start a single gdbserver instance
#    attached to the first MPI task
lgdb --pes=0 --command="aprun -n 64 -N 32 $VASP_EXEDIR/vasp" > stdout.txt
You should then submit this job in the usual way. Once the job is running, you will be able to inspect the contents of the 'stdout.txt' file to get the ID of the server to attach to using GDB. For example:
user@login1:/work/user/debug> less stdout.txt
sending /opt/cray/xt-tools/lgdb/1.4/xt/x86_64-unknown-linux-gnu/bin/lgdbd... completed
sending /opt/cray/xt-tools/lgdb/1.4/xt/x86_64-unknown-linux-gnu/bin/gdbserver... completed

*** create a new window and load the correct lgdb module for each target
*** run gdb from the following path:
/opt/cray/xt-tools/lgdb/1.4/xt/x86_64-unknown-linux-gnu/bin/gdb [PATH-TO-YOUR-APPLICATION]

*** the following gdb target commands should be used in separate windows
*** [Pe=0] to debug this Pe type the following in gdb
target remote nid00003:10000
This tells us the 'gdb' binary to use and indicates that we should use GDB to target the remote gdbserver at 'nid00003:10000'. On the login node command line run the specified 'gdb' executable:
user@login1:/work/user/debug> \\
  /opt/cray/xt-tools/lgdb/1.4/xt/x86_64-unknown-linux-gnu/bin/gdb $VASP_EXEDIR/vasp

dlopen failed on 'libthread_db.so.1' - /lib64/libthread_db.so.1: undefined symbol: ps_lgetfpregs
GDB will not be able to debug pthreads.

GNU gdb 6.8
Copyright (C) 2008 Free Software Foundation, Inc.
License GPLv3+: GNU GPL version 3 or later <http://gnu.org/licenses/gpl.html>
This is free software: you are free to change and redistribute it.
There is NO WARRANTY, to the extent permitted by law.  Type "show copying"
and "show warranty" for details.
This GDB was configured as "x86_64-unknown-linux-gnu"...
(gdb)
and then target the remote gdbserver with the command specified in the 'stdout.txt' file:
(gdb) target remote nid00003:10000
Remote debugging using nid00003:10000
[New Thread 22131]
0x00000000012aed60 in __read_nocancel () at ../sysdeps/unix/syscall-template.S:82
82      ../sysdeps/unix/syscall-template.S: No such file or directory.
        in ../sysdeps/unix/syscall-template.S
Current language:  auto; currently asm
Now we can add a breakpoint at one of our program functions and proceed to it. For example:
(gdb) b force_and_stress_
Breakpoint 1 at 0x87f168: file ./force.f, line 1160.
(gdb) c
Continuing.
Once the program has reached the specified breakpoint we can start debugging. To see the current backtrace of where we are in the program:
Breakpoint 1, force_and_stress_ (kineden=Cannot access memory at address 0x0
) at ./force.f:1160
1160          CALL START_TIMING("G")
Current language:  auto; currently fortran
(gdb) bt
#0  force_and_stress_ (kineden=Cannot access memory at address 0x0
) at ./force.f:1160
#1  0x000000000041ad48 in vamp () at ./main.f:2665
#2  0x00000000004008e0 in main ()
#3  0x0000000001374d14 in __libc_start_main (main=0x4008a0 <main>, argc=1, ubp_av=0x7fffffffb548,
    init=0x1375200 <__libc_csu_init>, fini=0x13751c0 <__libc_csu_fini>, rtld_fini=0, stack_end=0x7fffffffb538)
    at libc-start.c:226
#4  0x00000000004007a9 in _start () at ../sysdeps/x86_64/elf/start.S:113
We can list the source code lines and add another breakpoint further into the routine by line number:
(gdb) l 1160,1180
1160          CALL START_TIMING("G")
1161
1162          DO ISP=1,WDES%NCDIJ
1163             CALL RC_ADD(CHTOT(1,ISP),1.0_q,CHTOT(1,ISP),0.0_q,CHTOTL(1,ISP),GRIDC)
1164          ENDDO
1165          IF (LDO_METAGGA().AND.LMIX_TAU()) THEN
1166             DO ISP=1,WDES%NCDIJ
1167                CALL RC_ADD(KINEDEN%TAU(1,ISP),1.0_q,KINEDEN%TAU(1,ISP),0.0_q,KINEDEN%TAUL(1,ISP),GRIDC)
1168             ENDDO
1169          ENDIF
1170          RHOLM_LAST=RHOLM
1171
1172          IF (INFO%LCHCON .OR. INFO%LCORR) THEN
1173             CALL SET_CHARGE(W, WDES, INFO%LOVERL, &
1174                  GRID, GRIDC, GRID_SOFT, GRIDUS, C_TO_US, SOFT_TO_C, &
1175                  LATT_CUR, P, SYMM, T_INFO, &
1176                  CHDEN, LMDIM, CRHODE, CHTOT, RHOLM, N_MIX_PAW, IRDMAX)
1177
1178             CALL STOP_TIMING("G",IO%IU6,'CHARGE')
1179          ENDIF
1180    !----------------------- FORCES ON IONS    -----------------------------
(gdb) b ./force.f:1172
Breakpoint 2 at 0x87f37a: file ./force.f, line 1172.
and then proceed to this breakpoint:
(gdb) c
Continuing.

Breakpoint 2, force_and_stress_ (kineden=Cannot access memory at address 0x0
) at ./force.f:1172
1172          IF (INFO%LCHCON .OR. INFO%LCORR) THEN
Now we can examine the values of some of the variables
(gdb) ptype info%lchcon
type = logical
(gdb) p info%lchcon
$1 = .FALSE.
(gdb) ptype rholm
type = double precision (0,0)
(gdb) p rholm(1,1)
$2 = 0.051804883959039337
(gdb) p rholm(1,1)@3
$3 = (0.051804883959039337, 0.0083683781999898572, -0.0018751730313048671)
The last expression shows the next 3 array element values of rholm starting at (1,1).
Once you have finished debugging you can kill the running program and quit the debugger with the 'quit' command:
(gdb) q
The program is running.  Exit anyway? (y or n) y
7.5 DDT Debugger
DDT is a debugging tool for scalar, multi-threaded and large-scale parallel applications.
Example: debugging a parallel application
- Start an X-server on your local machine (if you need to).
- Login to system using ssh –Y to enable X-windows forwarding
- Compile your code using the -g option. Your code and executable must be on the "work" filesystem.
- Submit the DDT job to the batch system and leave the terminal you submitted the job from open.
Example DDT job submission script:
#!/bin/bash --login

#PBS -A z01
#PBS -l walltime=00:20:00
#PBS -l mppwidth=32
#PBS -l mppnppn=32
#PBS -v DISPLAY

# Load the DDT module
module load ddt

# Make sure any symbolic links are resolved to absolute path
export PBS_O_WORKDIR=$(readlink -f $PBS_O_WORKDIR)

cd $PBS_O_WORKDIR

# Debug the executable called "./hello"
ddt -start -noqueue -n 32 ./hello arg1 arg2
When the job starts, the DDT graphical interface should appear:
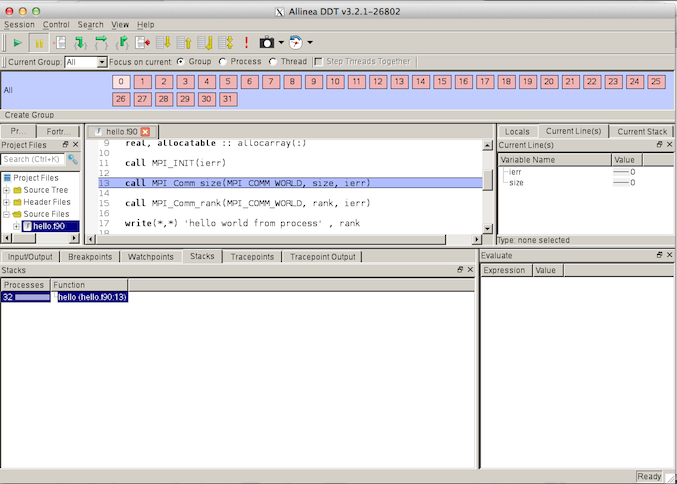
Here are some options you may choose:
- Play – make the processes in the current group run until they are stopped.
- Pause – cause the processes in the current group to pause, allowing you to examine them.
- Add Breakpoint – adds a breakpoint at a line of code, or a function, that will cause processes to pause as soon as they reach that location
- Step Into – will either step the current process group by a single line, or if the line involves a function call, it will step into the function instead.
- Step Over – will step the current process group by a single line.
- Step Out – will run the current process group to the end of their current function, and return to the calling location.
