Scientific Visualisation

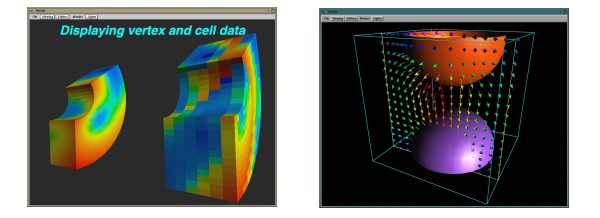
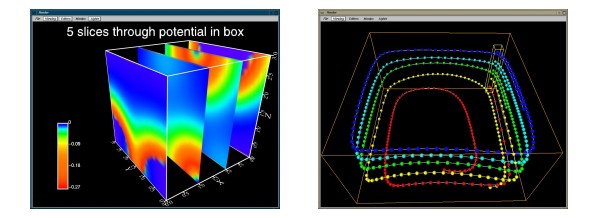
Description: Visualisation is a method of computing by which the enormous bandwidth and processing power of the human visual (eye-brain) system is exploited to extract knowledge from complex data. It uses computer graphics and imaging techniques to construct visual representations of the results from theoretical models, numerical simulation and physical experiment. This course starts by introducing visualisation from the point of view of the data, since understanding its nature (structure, coordinates, values, dimensionality) is a prerequisite for applying the techniques (e.g. plotting, contouring, rendering, particle tracing, etc) that are available. Several examples of the application of the techniques are presented, and attendees are encouraged to consider their utility for their own datasets. We also incorporate a brief survey of visualisation applications and toolkits, including practical exercises using Paraview and VisIt.
Aimed at: Any user with an interest in improving the methods by which they analyse data visually or needing to share results with other researchers in graphic forms.
Prerequisites: None.
Duration: 1 day.
After Course Attendees Will: Have an understanding of the various techniques which can be used to visualise complex datasets. Be in a position to improve their own use of visualisation both in terms of everyday working and the presentation of results.
Registration: To register for HECToR courses go to the booking form.
")