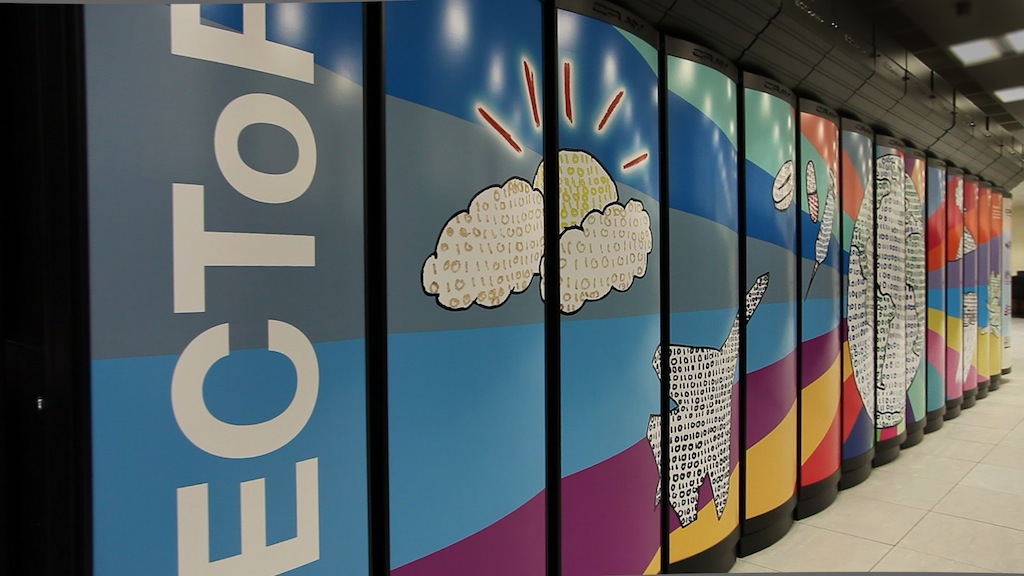
HECToR Monthly Report, April 2012
Information on the utilisation, disk allocations, slowdowns and helpdesk statistics can be found in the associated SAFE monthly report.
Dates covered: 08:00 1 April 2012 to 08:00 1 May 2012
Number of hours: 720
1: Availability
Scheduled down time: 8 hours 33 minutes.
Incidents
The following incidents were recorded:
| Severity | Number |
| 1 | 0 |
| 2 | 0 |
| 3 | 7 |
| 4 | 0 |
Of the four severity levels, level 1 corresponds to a contractual failure.
Out of the 16 SEV-3 Incidents, 16 were attributed to node failure events.
Details of severity level 1 incidents
None this month.MTBF and Serviceability
| Attribution | Failures | MTBF | UDT | Serviceability |
| Cray | 0 | ∞ | 00:00 | 100.0% |
| Site | 0 | ∞ | 00:00 | 100.0% |
| External | 0 | ∞ | 00:00 | 100.0% |
| Other/Unknown | 0 | ∞ | 00:00 | 100.0% |
| Overall | 0 | ∞ | 00:00 | 100.0% |
- Note 1: Serviceability%= 100*(WCT-SDT-UDT)/(WCT-SDT)
- Note 2: MTBF (Mean Time Between Failures) is defined as 732/Number of failures.
Details of single node failures
| Error Type | Number |
| MCA bank 4/bank 2 error | 3 |
| Software error - kernel panic | 1 |
| MCE threshold exceeded | 1 |
| Module voltage fault | 1 |
| Node down following PM (*) | 1 |
(*) No user job lost
2: Courses
This information is supplied by NAG Ltd| Title of Course | Dates | Available Places | Ordinary Attendees | Paying Attendees | CSE Staff | Total Attending |
| Parallel Programming with MPI, University of Bath | 11-13 April | 30 | 8 | 0 | 0 | 8 |
| DL_POLY, University of Warwick | 16-18 April | 20 | 14 | 0 | 0 | 14 |
| Advanced Computational Methods II (MSc), University of Southampton | 20, 27 April | 30 | 24 | 0 | 0 | 24 |
| Scientific Visualisation, Culham Science Centre | 21 April | 21 | 21 | 0 | 0 | 21 |
3: Quality Tokens
| Date | Tokens Awarded | Comment | Consortium |
| 13 April 2012 | * * * (three positive tokens) | No comment from user | e10 |
| 22 April 2012 | * * * * * (Five positive tokens) | So far, so good | x10 |
4: Hours Worked
| Group | Days worked | FTEs |
| USL | 75.6 | 4.2 |
| OSG | 75.0 | 4.2 |
5: Performance Metrics
Technology Provision
| Description | TSL | FSL | Value |
| Technology reliability | 85% | 98.5% | 100% |
| Technology throughput | 7000 hours | 8367 hours | 8681 hours |
| Capability job completion rate | 70% | 90% | 100% |
| Technology MTBF | 100 hours | 126.4 hours | ∞ |
Note: Technology throughput is calculated: 12*(732-UDT-SDT), where 732 is the annual average number of hours in a month.
Note: MTBF is calculated as 732/number of failures
Service Provision
| Description | TSL | FSL | USL | Value |
| Percentage of non-in-depth queries resolved within one day | 85% | 97% | 99% | 100% |
| Number of SP FTEs | 7.3 | 8.0 | 8.7 | 8.4 |
| SP Serviceability | 80% | 99% | 99.5% | 100% |
