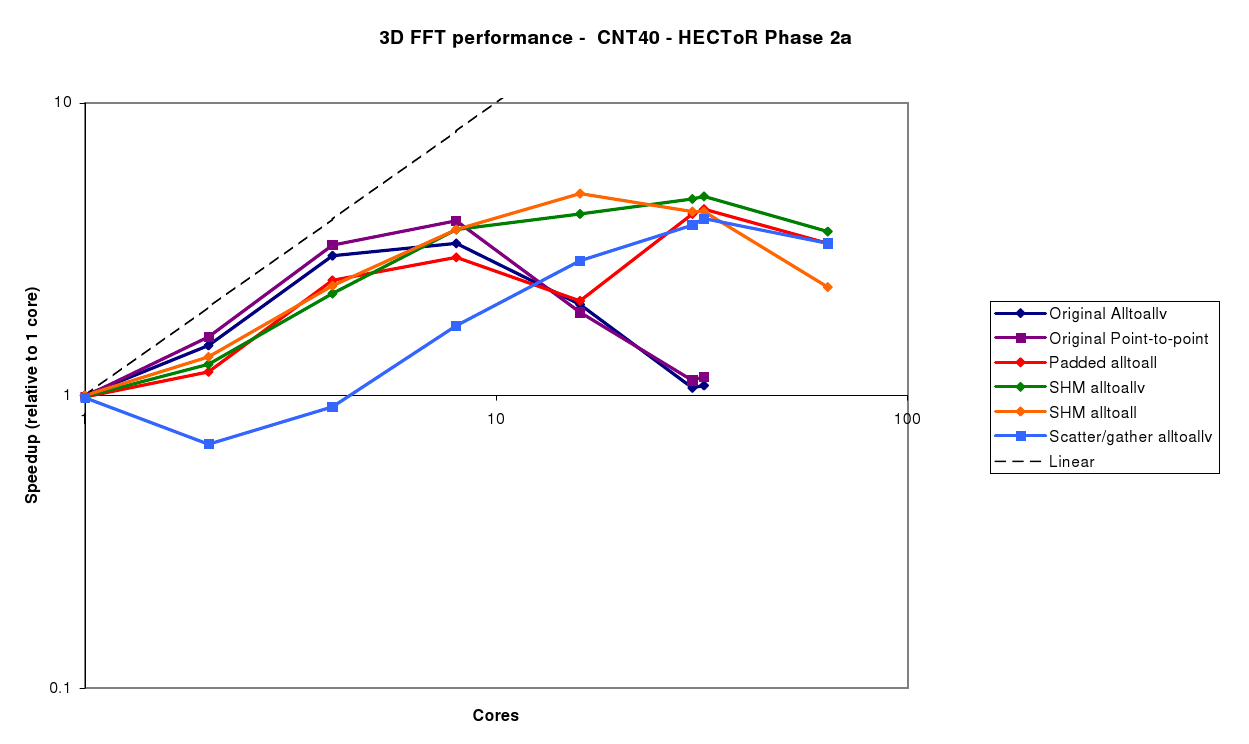
The CNT40 benchmark (figure 3) is small, and with the original code, only scales up to 8 cores before the performance drops off. It should be noted that in this case, the point-to-point method gives slightly better performance than the MPI_Alltoallv method. This is due to the fact that asynchronous message passing is used, so some of the buffer packing and unpacking cost is hidden as it takes place while other communications are outstanding. With the MPI_Alltoallv, the data for all processes must be packed first, the communication takes place synchronously, followed by unpacking again.
The padded Alltoall gives similar performance to the original Alltoallv code, with the slight slowdown due to the extra overhead of sending the padded data. However, beyond 16 cores, the message sizes drop below 1kB, and the impact of the store-and-forward algorithm can clearly be seen. However, as the grid size is only 303, the FFT no longer scales beyond 32 cores.
The SHM Alltoallv and SHM Alltoall both give similar performance, and perform best of the options available at the larger core counts (8-32).
The Scatter/Gather Alltoallv shows good scalability up to 32 cores, which we would expect as this is mainly due to the reduced number of processes participating in the MPI_Alltoallv operation. However, the extra overhead of scattering and gathering the data, along with the required extra data packing, mean that it does not perform nearly as well as the SHM version. It should be possible to remove the dip in performance for 2-4 cores, since in this case we could replace the packing, MPI_Alltoallv and unpacking with a simple data copy. However, as the focus of this work was extending the scalability of the FFT, this was not done.
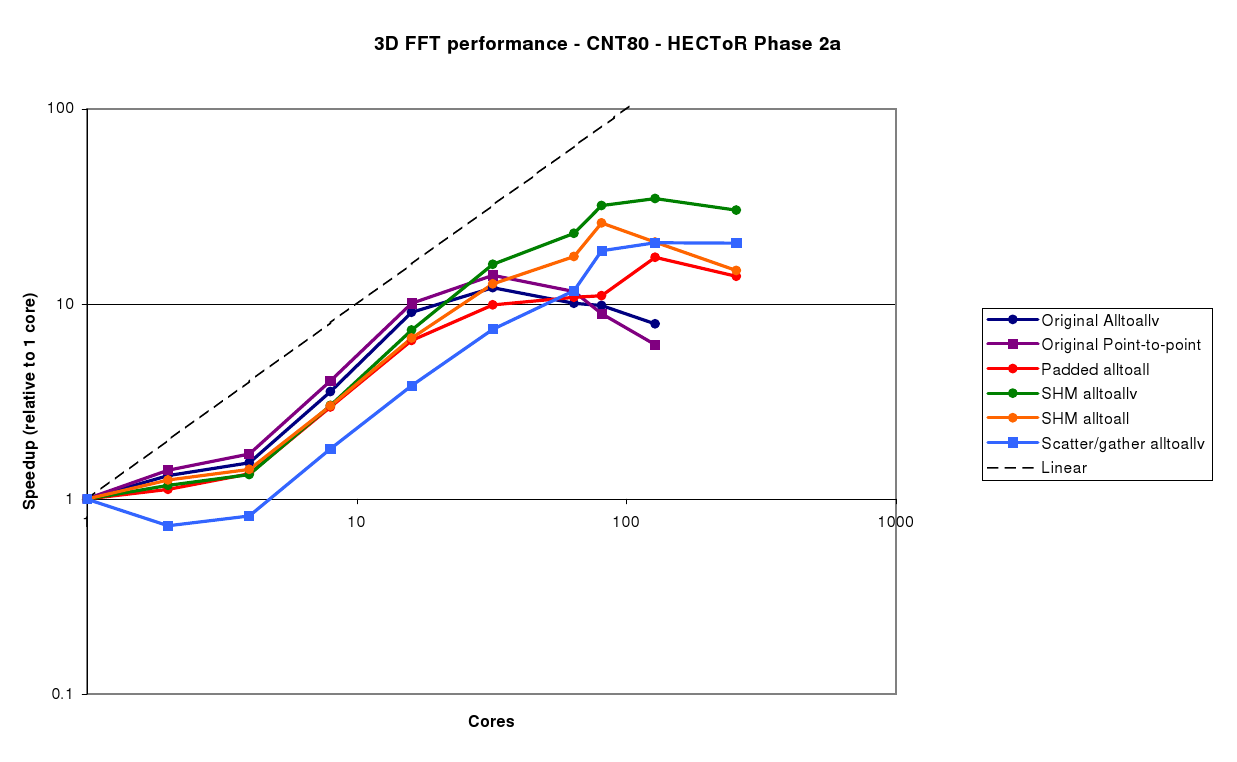
The CNT80 benchmark (figure 4) is larger - a 813 grid - so all the different algorithms scale well. The same trends as for the CNT40 case can be seen here, and again the SHM Alltoallv is clearly the best choice, giving good performance up to 128 cores.
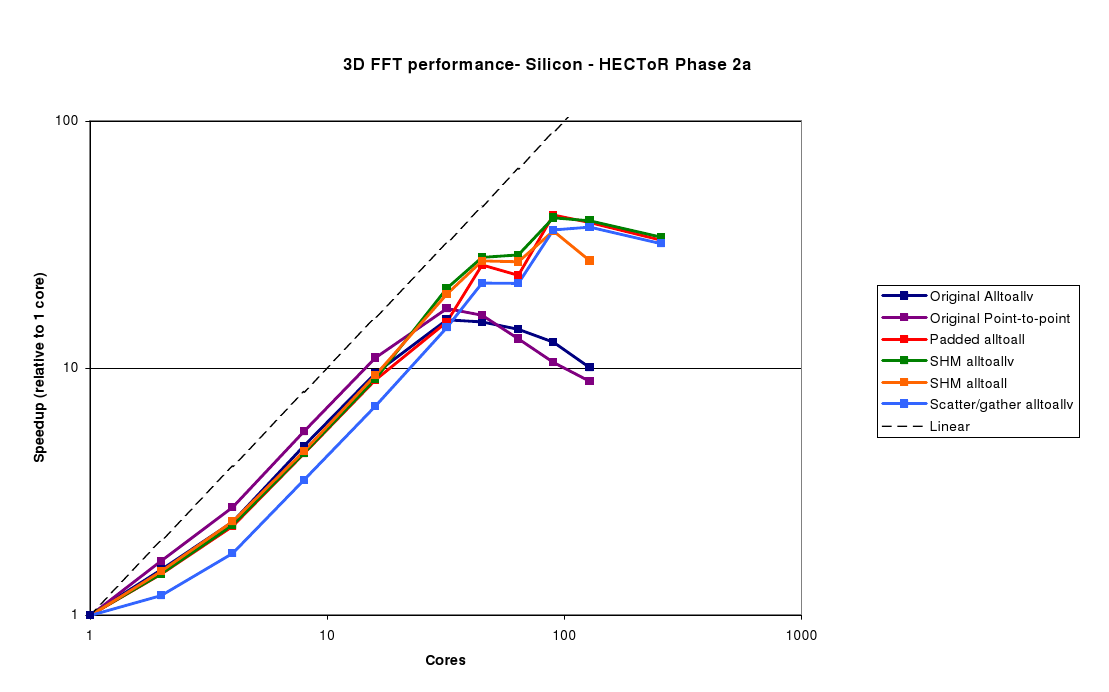
The Silicon benchmark (figure 5) is also slightly larger - 903 - and is very similar to the CNT80 case. Best performance here is achieved with 90 cores, and in this case, the Padded Alltoall and SHM alltoallv perform very similarly, as the padding overhead is very small since the number of processes divides the grid dimension exactly. There is also a clear gain in performance at 45 cores, indicating that picking the number of processors to match the grid dimensions can be a useful technique.
It is also worth making the point that in the region where the new FFT implementations stop scaling (e.g. 128 cores for the Silicon benchmark), they are around 4 times faster than the original implementations.