|
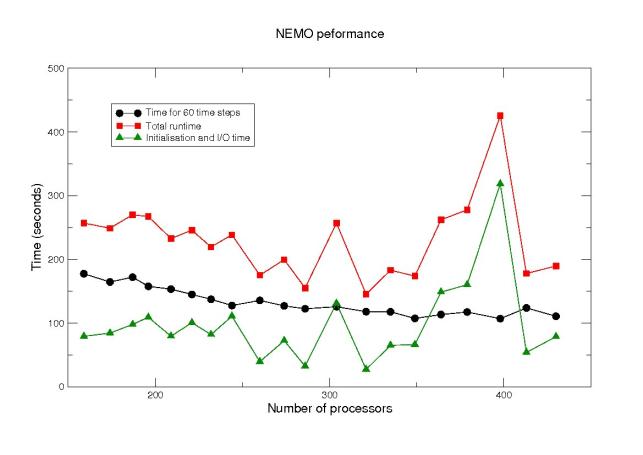
Up to 250 processors the difference between the total runtime and time for 60 time steps remains approximately constant. Beyond 250 the results are somewhat more erratic with large variations, of up to 200%, occurring between 350-400 processors. As the number of files opened for output increases linearly with the number of processors these variations are perhaps to be expected. The time spent in initialisation and I/O reported by Figure 7 was found to be highly variable with multiple runs producing up to 50% variation. Conversely, the time for 60 model time steps was observed to be relatively stable with variations lying within the expected range for repeated runs (5-10%). The large variation in the initialisation and I/O time occurs because the I/O subsystem on HECToR is a resource shared between other users. Thus, the speed of I/O is governed by the load the system is under at the time when the job runs. If the I/O system is heavily loaded when NEMO attempts to read/write from/to file then the time spent in I/O operations will be increased. This makes predicting the runtime of a NEMO job problematic as the total runtime will be governed by system load whilst the job is running.