Output from NEMO can be viewed using the nemoplotnc tool. Prior to using this tool some environment variables must be set to allow colour palette files and default data paths to be set. COLOUR2_DIR contains the path to the colour palette files and DATA_DIRPATH contains the path to the netCDF file to be read in. These can be set in bash shell as follows:
export COLOUR2_DIR = /home/n01/n01/acc/NEMOPLOT/colour2
export DATA_DIRPATH = /work/n01/n01/fionanem/NEMO/ORCA025/EXP001/
  O25-TST_CU30_19580101_19580101_grid_T.nc
export VMASK1 = 1.e20
VMASK1 is used to set the mask value (the value assigned to the land cells) such that the land cells get ignored when the data are plotted. Once these environment variables have been set the nemoplotnc command can be executed as follows:
~/NEMOPLOTNC/nemoplotnc
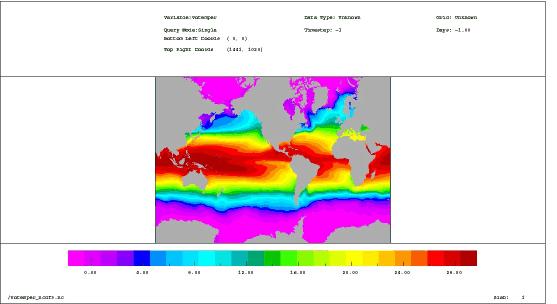
nemoplotnc can be used to view both single processor and combined netCDF files. Figure 2 shows a screen-snapshot from nemoplotnc for the temperature field generated as described in Section 5.3.