To measure the performance of the D&C algorithm with increasing system size,
the density matrix was computed for various supercells of crystalline neon with
a face centred cubic crystal structure (from the Inorganic Crystal Structure
Database [14]). The time taken to compute the density matrix
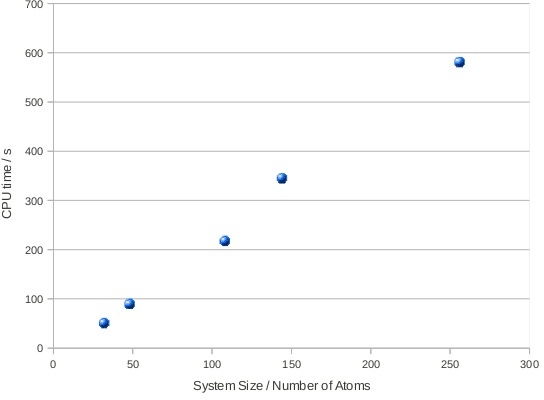
with varying systems size is shown in Figure 3. The scaling is
nearly linear. The non-linear part of the scaling comes from computing the
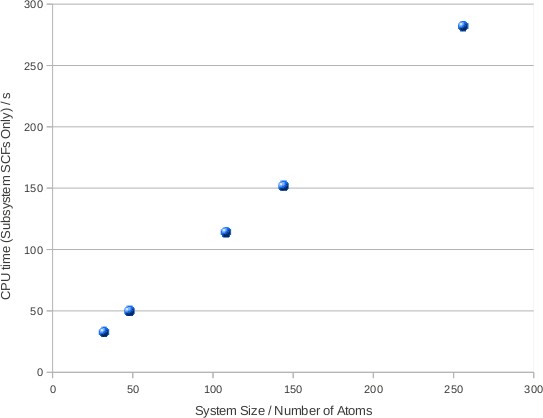
Fermi energy for the system. Figure 4 shows the time
taken to set up and compute the electronic structure of the subsystems. This
shows almost perfect linear scaling, and also shows that a substantial part of
the run time is spent computing the Fermi energy. Improvements to the
algorithm to compute the Fermi energy should be a priority in the continuation
of this work.
Figure 3:
The time taken to compute the density matrix using the divide and
conquer algorithm as a function of system size. The algorithm displays near
linear scaling.
|
|
Figure 4:
The CPU time taken to converge the SCF for all subsystems using the
D&C algorithm. This shows near perfect linear scaling. Further investigation
is needed to reduce the time taken to calculate the Fermi energy for the
system.
|
|
Daniel R. Jones 2011-12-06