Turbulent patches in oceans and atmospheres
Prof Ian P Castro, Dr T Glyn Thomas, Dr Sergey Yakovenko
School of Engineering Sciences
University of Southampton
The presence of patches of turbulent fluid within atmospheric or oceanic flows is well known (not least to aircraft passengers). There are different mechanisms leading to such patches, but one is that large-scale internal waves can become steep enough to break, rather like surface waves approaching a beach. The waves themselves arise for various reasons; mountain lee waves, for example, can occur when the air approaching the mountain range has a density decreasing with height. Wave breaking is a complex phenomenon and has been quite extensively explored. The subsequent breakdown to a fully turbulent patch, along with the latter’s development and (perhaps) eventual decay is not, however, well understood.
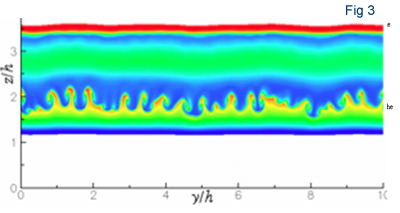
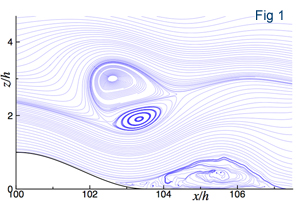
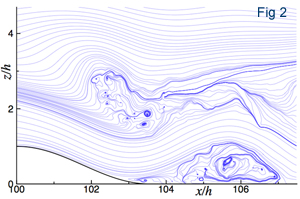
We have been using HECToR resources to compute such flows, analysing both the transition-to-turbulence process and the fully developed turbulence in the patch. The finest resolution computations have used over 1.3 billion grid points and typically required 640 processors running for 5 days, to achieve flow development sufficient to obtain turbulence statistics & spectra within the turbulent patch. Figure 1 shows particle pathlines at a time just prior to wave-breaking, Figure 2 shows the start of the transition process and Figure 3 illustrates the resulting turbulent patch. We have been analysing the features of this patch, determining in particular the way in which it is maintained and the rate at which it decays. Such studies are only feasible computationally and, for proper resolution of the flow at Reynolds numbers high enough to yield full turbulence development, can only be addressed on machines like HECToR.