Optimising
the performance of the VASP 5.2.2 code on HECToR
Richard Catlow, FRS, Scott Woodley, Nora De Leeuw
University College London
Andrew Turner
EPCC, University of Edinburgh, EH9 3JZ; a.turner@epcc.ed.ac.uk
9 November 2010
Abstract
This dCSE project report discusses
optimisation of the parallel performance of VASP 5.2.2 on HECToR Phase 2a/b. The
key aims of the project are to:
·
Determine the best values of the parameter
NPAR.
·
Optimise the shared memory collective
communications.
·
Introduce ScaLAPACK for the key linear
algebra routines.
·
Validate against a set of representative test
cases.
The individual achievements of the project
are documented within this report and they are summarised below:
·
Recommended settings for NPAR.
·
Preprocessing directives have been developed
for those users who wish to compile their own version of VASP 5.2.2. These
include improved collective communications and the elimination of unnecessary
zeroing of certain arrays. Furthermore, a shared memory approach to aggregate
intra node messages for communication is also available via these directives.
·
These performance improvements now enable
scalability to more than 128 processing cores for certain systems.
Contents
Introduction 3
Initial Performance and Profiling 5
Optimisations 9
Final Performance and Profiling 25
Conclusions and Further Work 28
Acknowledgement 28
Appendix A: Performance Data 28
Appendix B: Selecting NPAR 34
Introduction
VASP (Vienna Ab initio Simulation Package) is one of the most widely used codes in current computational condensed matter science. It is based on Density Functional Theory (DFT) employing pseudo-potentials and a plane-wave basis set for systems defined by three-dimensional periodic boundary conditions. The code has a wide range of functionality for geometry optimisation, analysis of electronic structure and for location of transition states. It is essentially complementary to the CASTEP package; has an extensive international user base; and is widely used in the UK.
Members of the Materials Chemistry Consortium (MCC) use the code for several classes of applications including:
(1) Analysis of electronic structure of bulk materials, including electron density distributions and band gaps.
(2) Modelling of intercalation reactions in materials, particularly in the context of solid-state batteries.
(3) Modelling of surfaces, where periodic boundary conditions require the use of “slab” calculations to model geometric and electronic structures of both clean and adsorbed surfaces.
(4) Modelling of reactions on surfaces, including location of transition states in catalytic reactions.
(5) Modelling of nucleation and growth processes.
Despite this wide user base, VASP currently does not currently perform well on HECToR. It cannot exploit large partitions and indeed most usage has been confined to less than 128 MPI tasks. The aim of this CSE project is therefore to optimise the VASP code to allow it to exploit the HECToR facility thereby facilitating an extensive range of new science.
Parallelism in VASP
VASP 5.2.2 currently uses pure MPI to implement its parallel algorithms (rather than, say, a hybrid programming model). A number of different MPI communicator groups are used in VASP. For example, the global communicator (which includes all parallel tasks) is used for the parallelisation of the pseudopotential calculation with each atom assigned to a distinct parallel task. In addition to this, the pool of MPI tasks is split into a two-dimensional grid of MPI communicators with each task having an identity in both a row andcolumn communicator group. The row communicators are often referred to as interband communicators and the column communicators as intraband communicators. These two communicator groups are used within the VASP code for different operations.
The distribution of rows and columns in the 2D communicator grid is controlled by the VASP runtime parameter NPAR. It is critical for performance and scaling that the value of NPAR is chosen appropriately for the system being studied and the hardware that VASP is running. Guidance on choosing the value of NPAR on the HECToR phase 2a, XT4 system is available in Appendix B.
Benchmarks
Five benchmark cases have been supplied by scientists from the MCC:
· Benchmark 1 – hydrogen defect in lithium; 64 atoms; G-point only; GGA DFT functional; PAW pseudopotential; single-point energy calculation.
· Benchmark 2 – hydrogen defect in lithium; 64 atoms; G-point only; hybrid DFT functional; PAW pseudopotential; single-point energy calculation.
· Benchmark 3 – hydrogen defect in palladium; 32 atom; 10 k-points; GGA DFT functional; PAW pseudopotential; single-point energy calculation.
· Benchmark 4 – hydrogen defect in palladium; 32 atom; 108 k-points; GGA DFT functional; PAW pseudopotential; single-point energy calculation.
· Benchmark 5 – Titanium oxide 3×3×3supercell; 750 atoms, G-point only, GGA functional; PAW pseudopotential; 6 SCF cycles.
Benchmarks 1 and 2 represent relatively small systems (64 atoms with few electrons); Benchmarks 3 and 4 have fewer atoms (32) with more electrons per atom;Benchamrk 5 represents a large system (750 atoms) with many electrons per atom. A range of calculation types including pure-DFT, hybrid-DFT, G-point and multiple k-point calculations are included to try to represent the breadth of use cases found within the MCC.
Initial Performance and Profiling
Performance and Scaling
To provide baseline performance and scaling for comparison with improvements made during this dCSE project we used the centrally provided VASP 5.2.2 executable available on HECToR at the start of the projectto run each of the supplied benchmarks for a range of core counts on the phase 2a system. Initial Makefiles corresponding to this VASP 5.2.2 build for the both multiple k-point and G-point versions of the code have been developed.
All the performance data are available in Appendix A.Unless otherwise indicated, all results used fully-packed nodes on the HECToR phase 2a system (i.e. 4-cores per node); use the G-point version of the VASP 5.2.2 code; and use the optimal value of the VASP NPAR parameter. See Appendix B for more information about choosing the optimal NPAR value on HECToR.
Figure 1 shows the initial scaling of the smaller MCC benchmarks. Benchmark 1 and 2 use the G-point version of the code and Benchmarks 3 and 4 use the multiple k-point version of the code. All of the smaller systems scale reasonably up to 64 cores but beyond this the parallel performance falls off,thus limiting the useful scaling range for the VASP code to 64 cores and lower. There is no benefit for using 256 cores in preference to 128 cores.
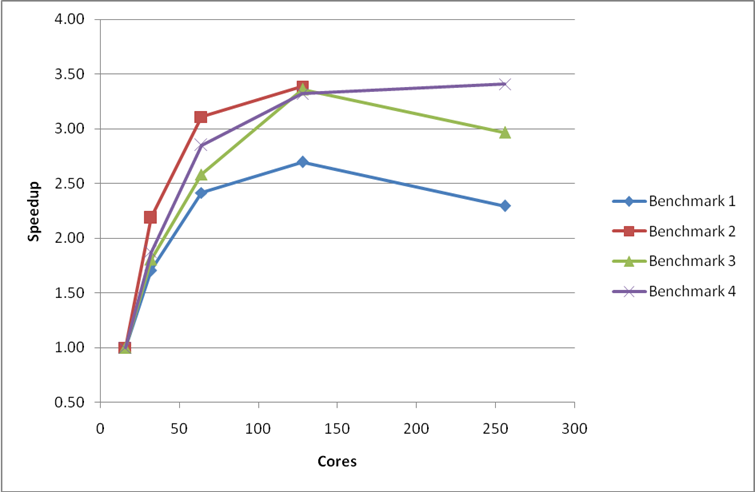
Figure 1: Initial performance and scaling of the small MCC VASP benchmarks on HECToR phase 2a. Benchmarks 1 and 2 use the G-point only code and benchmarks 3 and 4 use the multiple k-point code. Speedups are relative to the calculation time at 16 cores.
The initial scaling for the large MCC benchmark (Benchmark 5), using the G-point version of the code, is shown in Figure 2. The code shows reasonable scaling up to 512 cores for this larger benchmark. The performance at 1024 cores is worse than that at 128 cores. The VASP code obviously has issues in utilising large numbers of cores for this larger benchmark.
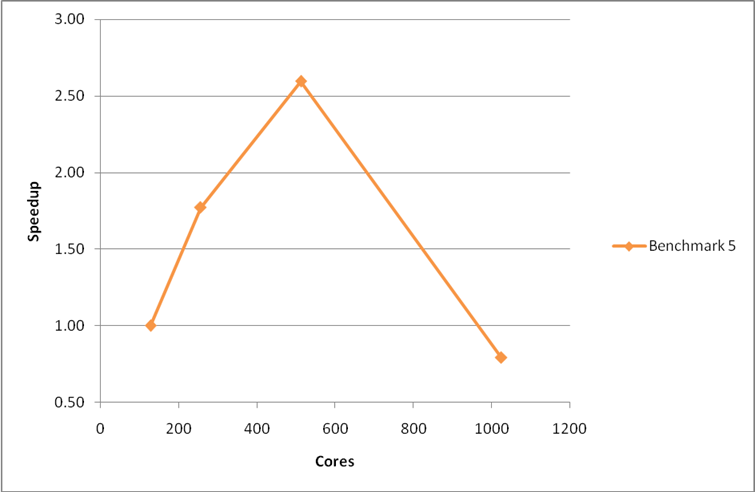
Figure 2: Initial performance and scaling of the large MCC VASP benchmark on HECToR phase 2a using the G-point only code. Speedup is measured relative to the performance at 128 cores.
As this part of the dCSE project is primarily concerned with the code performance for G-point calculations we concentrate on the performance of the MCC G-point Benchmarks (1, 2 and 5) for the remainder of this report. Benchmark 2 uses a hybrid-DFT functional and so excises a separate part of the code to the pure DFT Benchmarks (1 and 5). The hybrid-DFT calculation imposes additional restrictions on the parallelisation of VASP and so this Benchmark was not included in profiling and, as such, any optimisations implemented may not be as effective for hybrid-DFT calculations.
Profiling
To find how the time is distributed within the subroutines of the VASP code when performingG-point calculations we used the CrayPAT tool to profile runs with different core counts for Benchmarks 1 and 5. This will reveal any bottlenecks and where any additional effort should be applied in optimising the code. The results of this profiling are summarised below.
Profiles for Benchmark 1 at 64 cores (where the code is scaling well) and at 256 cores (where the code is no longer scaling) are shown in Table 1. We can see that at 64 cores the majority of calculation time is spent in the serial computation routines of the VASP code (labelled as “User Routines” in the CrayPAT profiles) and library routines performing, for example linear algebra and array operations) rather than communications (MPI routines). We can contrast this with the profiling results at 256 cores where the majority of time is spent in communications rather than in serial computation.At 256 cores the majority of this communication time is spent synchronising the parallel tasks (MPI_Waitall and MPI_Barrier). After synchronisation, the most time consumingMPI communication routines are the point-to-point routines (MPI_Isend and MPI_Irecv).
|
64 Cores |
256 Cores |
|
|
|
% Sample Time |
Routine Name/Group |
% Sample Time |
Routine Name/Group |
|
62.60% |
User Routines |
50.30% |
MPI Routines |
|
9.70% |
fpassm_ |
21.80% |
mpi_waitall_ |
|
9.00% |
setylm_aug_ |
10.90% |
mpi_barrier_ |
|
6.10% |
hamil_eccp_ |
8.80% |
mpi_isend_ |
|
5.20% |
ipassm_ |
3.70% |
mpi_irecv_ |
|
3.50% |
fft3d_mpi_ |
3.10% |
mpi_allreduce_ |
|
3.10% |
vhamil_ |
39.60% |
User Routines |
|
2.90% |
racc0mu_ |
14.50% |
setylm_aug_ |
|
2.30% |
nonlr_rpromu_ |
3.60% |
fpassm_ |
|
2.10% |
fftwav_mpi_ |
2.40% |
nonlr_rspher_all_ |
|
2.10% |
asa_setylm_ |
2.20% |
hamil_eccp_ |
|
23.70% |
MPI Routines |
10.10% |
Library Routines |
|
8.70% |
mpi_waitall_ |
|
|
|
6.90% |
mpi_barrier_ |
|
|
|
3.00% |
mpi_isend_ |
|
|
|
2.70% |
mpi_allreduce_ |
|
|
|
13.70% |
Library Routines |
|
|
|
2.20% |
dgemm_otcopy |
|
|
|
2.00% |
dgemv_t |
|
|
|
Table 1: CrayPAT sampling results for original code, benchmark 1 on 64 and 256 cores. |
The profiling results for the large MCC benchmark (Benchmark 5) at 512 cores are shown in Table 2. The code scales reasonably at this core count and as found for the smaller benchmarks the majority of the time is spent in serial computation. Moreover, the majority of the communication time is spent in synchronisation between different parallel tasks and in the point-to-point communication routines.
|
512 Cores |
|
|
% Sample Time |
Routine Name/Group |
|
58.70% |
User
Routines |
|
46.20% |
nonl_fornl_ |
|
3.80% |
crexp_mul_wave_ |
|
2.20% |
work_mul_crexp_ |
|
1.70% |
pawsym_augsym_ |
|
1.00% |
rhosyg_ |
|
21.60% |
MPI
Routines |
|
14.80% |
mpi_waitall_ |
|
2.30% |
mpi_isend_ |
|
2.00% |
mpi_bcast_ |
|
1.10% |
mpi_irecv_ |
|
19.80% |
Library
Routines |
|
4.60% |
dgemv_t |
|
3.80% |
dgemv_n |
|
3.10% |
dsymv_U |
|
2.90% |
dgemm_kernel |
|
2.80% |
__fmth_i_dsincos_gh |
|
Table 2: CrayPAT sampling results for original code, benchmark 5 on 512 cores. |
The profiling results for the communication routines seem rather strange: we would expect, of course, that the amount of time spent in communications will increase as the number of cores used increases; but for a code such as VASP we would expect the majority of the communication time to be in collective communication routines (MPI_Alltoall, MPI_Alltoallv, etc.) rather than in point-to-point communications.
Optimisations
The optimisations on the VASP 5.2.2 code are presented in the same order that they have been applied. Initially, we focussed on the communication routines as they accounted for the majority of the time at high-core counts.
Patch files for all the source code changes have been developed.
Enforce use of MPI collectives
The initial profiling performed above revealed the surprising fact that the majority of time was spent in point-to-point MPI communication routines rather than, as expected, collective MPI communication routines.
Further investigation revealed that, by default, VASP uses point-to-point communication routines to mimic the behaviour of collective communication routines. The VASP authors found that this gave better performance for low core counts on Linux clusters. This is a sub-optimal solution on HECToR where we would expect the best performance by using the collective communication routines optimised for the XT high-speed network (HSN).
Our first change to the VASP code was therefore to enforce the use of MPI collective communication routines in appropriate places. This was achieved by using a combination of pre-processor flags in the VASP makefile ‘USE_COLLECTIVE’ and source code modifications to the mpi.F file (enclosed in ‘CRAY_XT’ pre-processor flags) so that the optimisations can be dynamically applied at compile time for different systems.
With these changes in place, the performance and scaling were re-evaluated and are shown below compared to the original performance.
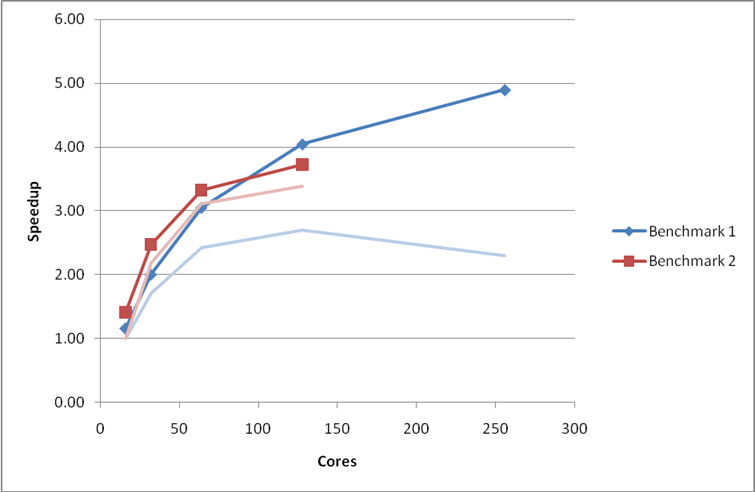
Figure 3: Performance and scaling of the small MCC VASP benchmarks on HECToR phase 2a with the use of MPI collective communication routines enforced. The pale curves indicate the speedup of the original code.Using the G-point only code.
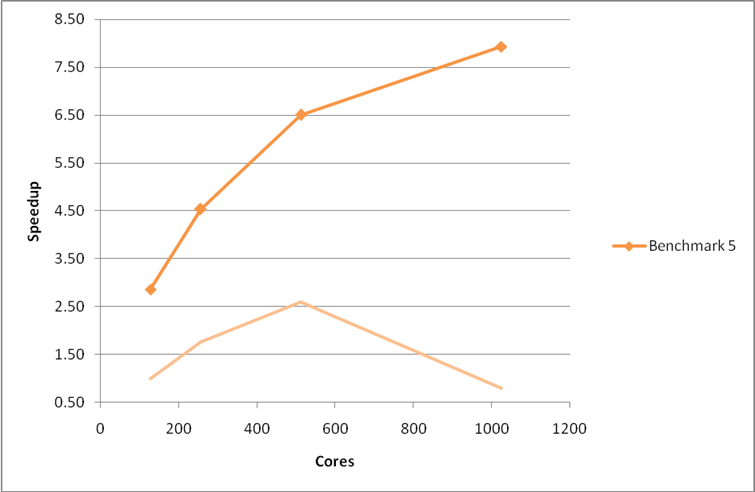
Figure 4: Performance and scaling of the large MCC VASP benchmark for the code with the use of MPI collective routines enforced. The pale curve indicate the speedup of the original code. Using the G-point only code.
We see a vast improvement in both theperformance and scaling of Benchmarks 1 and 5 from this relatively simple change. The improvement to Benchmark 2 is less marked, possibly due to the fact that the value of NPAR cannot be altered to take full advantage of the faster routines.
After this change, the code was re-instrumented using CrayPAT and the Benchmarks re-profiled with the results shown in Table 3 and Table 4.
|
64 Cores |
256 Cores |
|
|
|
% Sample Time |
Routine Name/Group |
% Sample Time |
Routine Name/Group |
|
44.80% |
User Routines |
46.30% |
Library Routines |
|
5.60% |
fpassm_ |
13.80% |
__c_mzero8 |
|
4.90% |
fft3d_mpi_ |
8.00% |
pgf90_str_copy |
|
3.60% |
vhamil_ |
7.00% |
pgf90_strcmp |
|
3.40% |
fftwav_mpi_ |
2.40% |
dlaebz_ |
|
3.20% |
ipassm_ |
2.00% |
fr_move_fwd |
|
3.00% |
map_forward_ |
38.60% |
MPI Routines |
|
2.40% |
racc0mu_ |
14.90% |
mpi_barrier_ |
|
2.30% |
rcomb_ |
9.70% |
mpi_allreduce_ |
|
2.10% |
hamil_eccp_ |
5.80% |
mpi_alltoall_ |
|
37.10% |
Library Routines |
5.70% |
mpi_alltoallv_ |
|
7.40% |
__c_mzero8 |
2.40% |
mpi_bcast_ |
|
4.60% |
pgf90_str_copy |
15.10% |
User Routines |
|
4.10% |
pgf90_strcmp |
2.00% |
fpassm_ |
|
2.80% |
daxpy_k |
|
|
|
2.80% |
dgemv_t |
|
|
|
2.60% |
dgemm_otcopy |
|
|
|
2.00% |
dgemm_kernel |
|
|
|
18.10% |
MPI Routines |
|
|
|
4.80% |
mpi_alltoall_ |
|
|
|
4.30% |
mpi_allreduce_ |
|
|
|
4.10% |
mpi_barrier_ |
|
|
|
3.80% |
mpi_alltoallv_ |
|
|
|
Table 3: CrayPAT sampling results for code using collectives, benchmark 1 on 64 and 256 cores. |
|
512 Cores |
|
|
% Sample
Time |
Routine Name/Group |
|
42.90% |
Library Routines |
|
9.70% |
dgemv_t |
|
7.70% |
dgemm_kernel |
|
7.40% |
dsymv_U |
|
7.00% |
dgemv_n |
|
3.30% |
__fvdsincos_gh |
|
32.20% |
MPI Routines |
|
14.40% |
mpi_alltoall_ |
|
11.70% |
mpi_allreduce_ |
|
3.90% |
mpi_bcast_ |
|
24.90% |
User Routines |
|
14.70% |
nonl_fornl_ |
|
3.10% |
crexp_mul_wave_ |
|
2.40% |
work_mul_crexp_ |
|
Table 4: CrayPAT sampling results for code using collectives, benchmark 5 on 512 cores. |
We now see that the largest proportion of the communication time for Benchmark 1 at 64 cores and Benchmark 5 is spent in the MPI_Alltoall routine (found to be in the PAW pseudopotential calculation). Closer investigation of these routines revealed that the MPI_Alltoallroutine was being used as a substitute for a global reduce and scatter operation. On the XT architecture this operation is most efficiently performed using the MPI_Allreduce routine.
The MPI_Alltoall calls were replaced by MPI_Allreduce giving a large improvement in performance and scaling for benchmark 2 (see Figure 5). For benchmark 5 we only see a small improvement in performance at the highest cores counts (see Figure 6), profiling (Table 6) reveals that the MPI_Allreduce routine now accounts for the largest proportion of communication time.
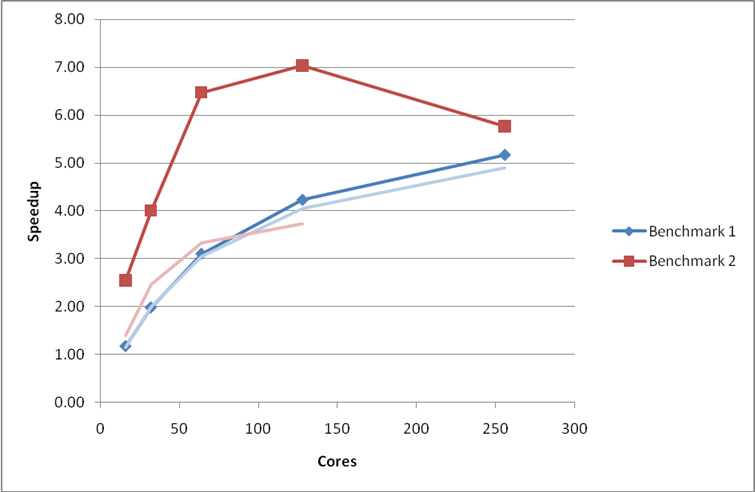
Figure 5: Performance and scaling of the small MCC VASP benchmarks for the code with MPI_Allreduce used in the PAW pseudopotential calculation. The pale curves indicate the performance of the previous optimisation phase. Using the G-point only code.
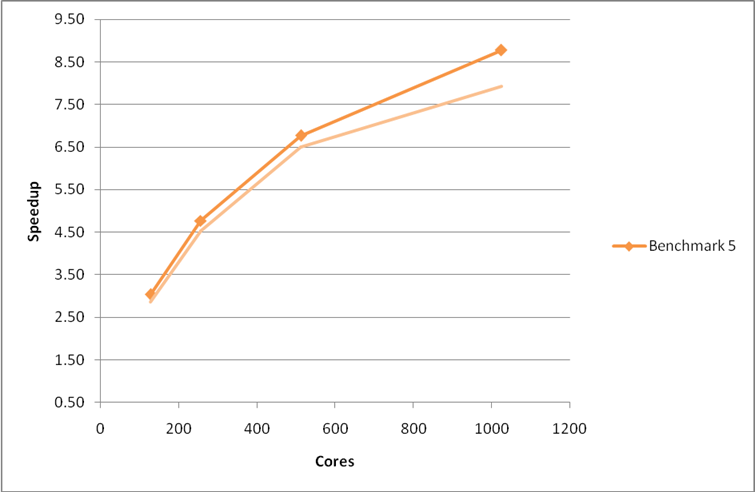
Figure 6: Performance and scaling of the large MCC VASP benchmark for the code with MPI_Allreduce used in the PAW pseudopotential calculation. The pale curves indicate the performance of the previous optimisation phase. Using the G-point only code.
The updated profiles of the modified VASP are shown inTable 5 and Table 6.
|
64 Cores |
256 Cores |
|
|
|
% Sample Time |
Routine Name/Group |
% Sample Time |
Routine Name/Group |
|
41.30% |
User Routines |
58.20% |
MPI Routines |
|
6.80% |
fpassm_ |
18.60% |
mpi_alltoallv_ |
|
4.40% |
vhamil_ |
18.00% |
mpi_allreduce_ |
|
4.00% |
ipassm_ |
13.50% |
mpi_barrier_ |
|
3.30% |
racc0mu_ |
5.50% |
mpi_alltoall_ |
|
2.90% |
fftwav_mpi_ |
2.60% |
mpi_bcast_ |
|
33.00% |
Library Routines |
28.40% |
Library Routines |
|
10.70% |
__c_mzero8 |
15.70% |
__c_mzero8 |
|
3.80% |
dgemv_t |
2.60% |
dlaebz_ |
|
3.50% |
dgemm_otcopy |
13.40% |
User Routines |
|
2.50% |
dgemm_kernel |
2.30% |
fpassm_ |
|
2.30% |
daxpy_k |
|
|
|
25.70% |
MPI Routines |
|
|
|
7.60% |
mpi_allreduce_ |
|
|
|
6.00% |
mpi_barrier_ |
|
|
|
5.70% |
mpi_alltoallv_ |
|
|
|
5.40% |
mpi_alltoall_ |
|
|
|
Table 5: CrayPAT sampling results for code using MPI_Allreduce, benchmark 1 on 64 and 256 cores. |
|
512 Cores |
|
|
% Sample Time |
Routine Name/Group |
|
42.10% |
Library Routines |
|
9.30% |
dgemv_t |
|
7.50% |
dgemm_kernel |
|
7.30% |
dsymv_U |
|
6.60% |
dgemv_n |
|
3.20% |
__fvdsincos |
|
2.00% |
dgemm_oncopy |
|
32.40% |
MPI Routines |
|
22.50% |
mpi_allreduce_ |
|
4.20% |
mpi_bcast_ |
|
3.30% |
mpi_alltoallv_ |
|
25.50% |
User Routines |
|
14.10% |
nonl_fornl_ |
|
3.90% |
crexp_mul_wave_ |
|
2.50% |
work_mul_crexp_ |
|
Table 6: CrayPAT sampling results for code using MPI_Allreduce, benchmark 5 on 512 cores. |
Remove array zeroing operations
The latest CrayPAT sampling run on Benchmark 1 (Table 5) suggests that around 16% of the runtime at 256 cores (10% at 64 cores) is being spent in zeroing arrays. Analysis of the VASP code suggested that in many cases this was not needed on the Cray XT and, as such, the offending lines were removed in the CRAY_XT version of the code. As can be seen from Figure 7 and Figure 8 this change improved the performance and scaling of benchmark 1 but had little effect on benchmarks 2 and 5.
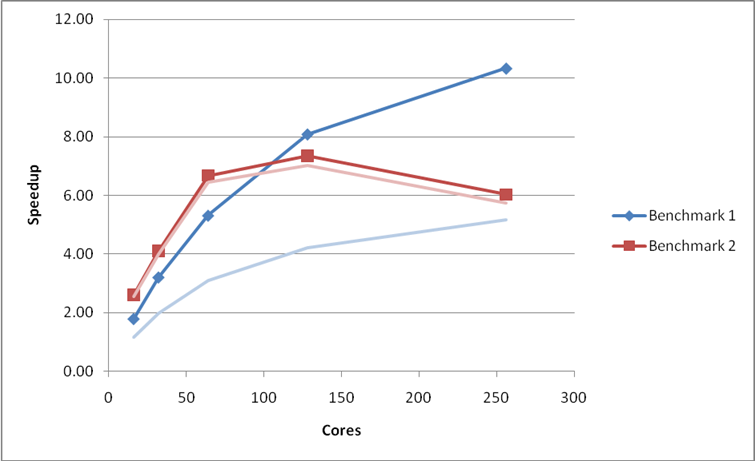
Figure 7: Performance and scaling of the small MCC VASP benchmarks for the code with array zeroing operations removed. Using the G-point only code.
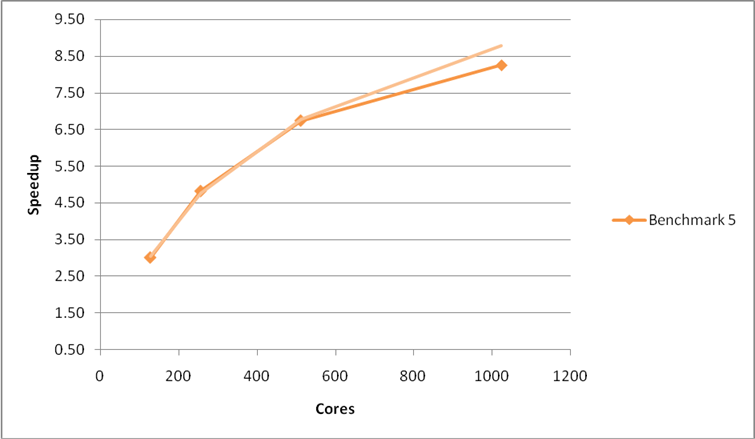
Figure 8: Performance and scaling of the large MCC VASP benchmark for the code with array zeroing operations removed. Using the G-point only code.
Table 7 shows the profiling results for the new version of the code for Benchmark 1 and Table 8 the profiling results for Benchmark 5. It is obvious that the proportion of time spent zeroing arrays has been reduced drastically for Benchmark 1 (down to 2.2% at 64 cores and 3.8% at 256 cores). Array zeroing was not a large proportion of the time for Benchmark 5 which explains why there was not change in performance or the profile for this case.
|
64 Cores |
256 Cores |
|
|
|
% Sample Time |
Routine Name/Group |
% Sample Time |
Routine Name/Group |
|
45.70% |
User
Routines |
50.20% |
MPI
Routines |
|
7.60% |
fpassm_ |
17.70% |
mpi_allreduce_ |
|
4.90% |
vhamil_ |
15.70% |
mpi_barrier_ |
|
4.50% |
ipassm_ |
7.90% |
mpi_alltoallv_ |
|
3.70% |
racc0mu_ |
4.70% |
mpi_alltoall_ |
|
3.10% |
fftwav_mpi_ |
3.60% |
mpi_bcast_ |
|
2.00% |
nonlr_rpromu_ |
25.30% |
Library
Routines |
|
27.70% |
MPI
Routines |
3.90% |
dlaebz_ |
|
8.10% |
mpi_allreduce_ |
3.80% |
__c_mzero8 |
|
6.40% |
mpi_alltoallv_ |
2.50% |
dgemm_kernel |
|
6.20% |
mpi_barrier_ |
2.50% |
dgemv_t |
|
5.70% |
mpi_alltoall_ |
24.50% |
User
Routines |
|
26.60% |
Library
Routines |
3.50% |
fpassm_ |
|
4.20% |
dgemv_t |
2.20% |
vhamil_ |
|
3.80% |
dgemm_otcopy |
2.10% |
ipassm_ |
|
2.80% |
dgemm_kernel |
|
|
|
2.50% |
daxpy_k |
|
|
|
2.20% |
__c_mzero8 |
|
|
|
2.00% |
dlaebz_ |
|
|
|
Table 7: CrayPAT sampling results for code with array zeroing removed, benchmark 1 on 64 and 256 cores. |
|
512 Cores |
|
|
% Sample
Time |
Routine Name/Group |
|
54.50% |
Library Routines |
|
24.10% |
dgemv_t |
|
15.80% |
dgemv_n |
|
4.50% |
dgemm_kernel |
|
3.70% |
dsymv_U |
|
24.70% |
User Routines |
|
11.00% |
nonl_fornl_ |
|
6.30% |
crexp_mul_wave_ |
|
3.80% |
work_mul_crexp_ |
|
20.80% |
MPI Routines |
|
14.70% |
mpi_allreduce_ |
|
2.50% |
mpi_bcast_ |
|
Table 8: CrayPAT sampling results for code with array zeroing removed, benchmark 5 on 512 cores. |
Introduce ScaLAPACK for linear algebra
As the latest profiling for the large Benchmark 5 reveals (Table 8) the majority of time for large systems in the current version of VASP is spent in the LAPACK linear algebra subroutines (dgemv and dsymv). For larger systems at high core counts we would expect that distributing these linear algebra calculations across all the cores could lead to both a significant improvement in scaling performance and a reduction in the amount of memory needed per core. We investigated this by using the VASP ‘ScaLAPACK’ pre-processor directive in the Makefiles to includeScaLAPACK routines for the subspace rotation.
The profile for Benchmark 1 (Table 7) indicates that the linear algebra performance is not as critical for smaller calculations and we would expect the inclusion of parallel linear algebra routines to have a smaller impact for these cases. This is presumably due to the fact that the matrices being manipulated are much smaller than for the large benchmark.
Figure 10 below reveals that inclusion of these parallel linear algebra routines improves the performance and scaling for the Benchmark 5, particularly at high core counts. As expected from the profiles above, inclusion of ScaLAPACK does not improve the performance for the smaller benchmarks (1 and 2). In fact, the additional overhead associated with using the ScaLAPACK routines degrades the performance for benchmark 1 considerably.
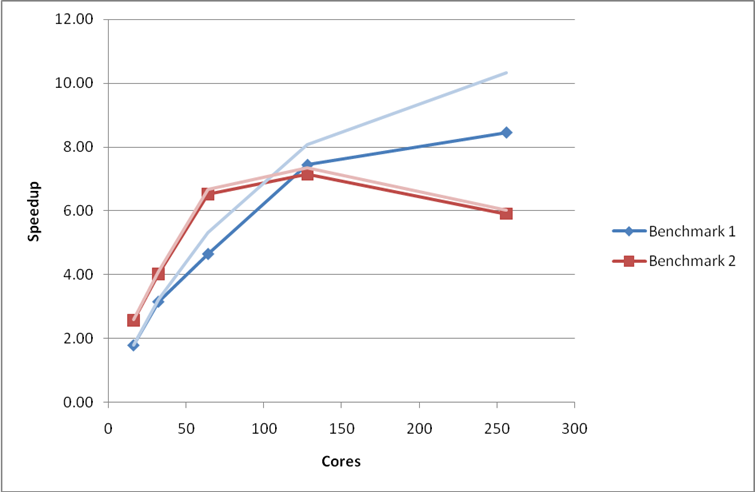
Figure 9: Performance and scaling of the small MCC VASP benchmarks for the code using ScaLAPACK for the linear algebra operations. Using the G-point only code.
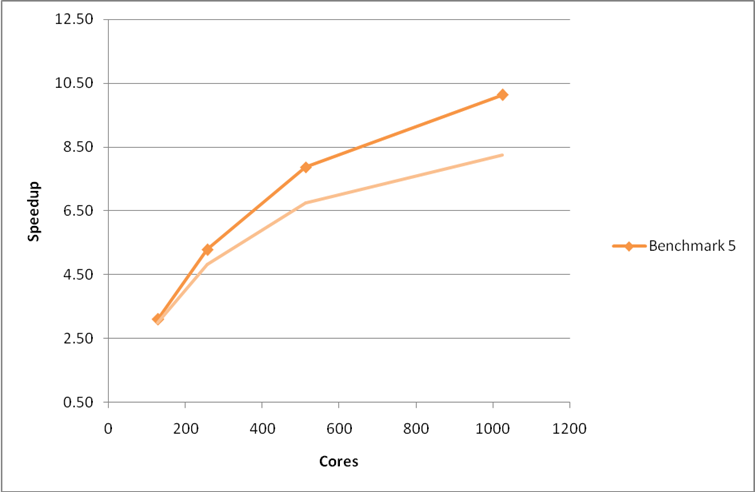
Figure 10: Performance and scaling of the large MCC VASP benchmark for the code using ScaLAPACK for the linear algebra operations. Using the G-point only code.
The CrayPAT profile for the large Benchmark 5 using code with ScaLAPACK included (Table 10) show that the time spent in the dsymv and dgemm_kernel routines have gone from the library routines section and the proportion of time spent in communications has risen slightly as would be expected when using a distributed linear algebra routine.
For Benchmark 1 (Table 9) the profile reveals that the proportion of time spent in communication routines has risen relative to previous profiles reflecting the additional communication needed for the ScaLAPACK routines.
|
64 Cores |
256 Cores |
|
|
|
% Sample Time |
Routine Name/Group |
% Sample Time |
Routine Name/Group |
|
44.10% |
User
Routines |
73.60% |
MPI
Routines |
|
7.30% |
fpassm_ |
20.60% |
mpi_alltoallv_ |
|
4.70% |
vhamil_ |
20.20% |
mpi_allreduce_ |
|
4.50% |
ipassm_ |
12.30% |
mpi_barrier_ |
|
3.40% |
racc0mu_ |
9.70% |
MPI_Bcast (ScaLapack) |
|
3.00% |
fftwav_mpi_ |
5.30% |
mpi_alltoall_ |
|
2.00% |
nonlr_rpromu_ |
2.80% |
mpi_bcast_ |
|
34.40% |
MPI
Routines |
15.10% |
User
Routines |
|
8.80% |
mpi_allreduce_ |
2.60% |
fpassm_ |
|
7.30% |
mpi_barrier_ |
11.40% |
Library
Routines |
|
6.30% |
mpi_alltoallv_ |
3.10% |
__c_mzero8 |
|
5.30% |
mpi_alltoall_ |
|
|
|
4.00% |
MPI_Bcast (ScaLapack) |
|
|
|
21.50% |
Library
Routines |
|
|
|
4.00% |
dgemv_t |
|
|
|
3.90% |
dgemm_otcopy |
|
|
|
2.30% |
daxpy_k |
|
|
|
2.10% |
__c_mzero8 |
|
|
|
2.00% |
dgemm_kernel |
|
|
|
Table 9: CrayPAT sampling results for code using ScaLAPACK for linear algebra, benchmark 1 on 64 and 256 cores. |
|
512 Cores |
|
|
% Sample Time |
Routine Name/Group |
|
48.90% |
Library Routines |
|
23.90% |
dgemv_t |
|
17.70% |
dgemv_n |
|
2.60% |
__fvdsincos_gh |
|
27.50% |
User Routines |
|
12.30% |
nonl_fornl_ |
|
6.40% |
crexp_mul_wave_ |
|
4.40% |
work_mul_crexp_ |
|
23.60% |
MPI Routines |
|
16.00% |
mpi_allreduce_ |
|
2.80% |
mpi_bcast_ |
|
Table 10: CrayPAT sampling results for code using ScaLAPACK for linear algebra, benchmark 5 on 512 cores. |
It is clear from these profiles that one of the largest barriers to scaling of the VASP code is the fact that a large amount of time is spent in MPI_Allreduce. Analysis of the VASP code revealed that this time consuming collective operation is in the PAW pseudopotential calculation and that the large amount of time spent here is not solely due to the speed of the communication but often due to load imbalance in the code.
The load imbalance arises from the parallelisation strategy used for the PAW pseudopotential calculation. The PAW pseudopotential calculation in parallelised by assigning the calculation for each atom to an individual parallel task. This strategy effectively caps the scaling of the code by the number of atoms in the system. As soon as there are more atoms than parallel tasks, some of the tasks will be sitting idle. This is particularly apparent in the profile for Benchmark 1 at 256 cores (Table 9) as the system only contains 64 atoms. During the PAW pseudopotential part of the calculation three quarters of the parallel tasks are sitting idle. This manifests itself as an extremely large amount of time spent in the MPI_Allreduce routine. This effect can also be seen in a profile of Benchmark 5 at 2048 cores (Table 11) where 1298 cores will be idle.
|
2048 Cores |
|
|
% Sample Time |
Routine Name/Group |
|
46.40% |
MPI
Routines |
|
28.10% |
mpi_allreduce_ |
|
6.20% |
mpi_alltoallv_ |
|
5.80% |
mpi_bcast_ |
|
2.70% |
mpi_barrier_ |
|
2.30% |
MPI_Bcast |
|
42.00% |
Library
Routines |
|
18.50% |
dlasr_ |
|
5.30% |
dgemv_t_ |
|
4.20% |
dgemv_n_ |
|
3.10% |
dgemm_kernel |
|
3.10% |
__fvdsincos |
|
11.60% |
User
Routines |
|
3.60% |
nonl_fornl_ |
Table 11: CrayPAT sampling results for code using ScaLAPACK for linear algebra, benchmark 5 on 2048 cores.
Fixing this issue is beyond the scope of the 4 months of effort assigned to this dCSE project but it will be the object of a future dCSE project proposal.
Include shared-memory modifications for MPI_Alltoallv
The last profile for Benchmark 1 (Table 9) indicates that a large amount of time is spent in the MPI_Alltoallv routine (part of the 3D FFT calculation). (It is worth noting, however, that this is not an important routine for Benchmark 1 at 64 cores or for Benchmark 5.) As each HECToR node is made up of multiple cores and, in the limit of small messages, the communication is limited by the latency of the interconnects; there may be some advantage to be gained by aggregating small messages on a node using shared memory segments. These larger messages can then be sent off-node using the standard MPI_Alltoallv routine. As more and more cores are added to a single node we would expect this approach to have more of an effect on performance.
David Tanqueray of Cray Inc. has previously produced a set of modifications for the VASP 4.6 code that add this functionality. To gauge the impact of using this approach in VASP 5.2 we ported the modifications in the VASP 5.2.2 codebase.Note that we would not expect these changes to have much effect on the performance of Benchmark 1 at lower core counts or Benchmark 5 as they do not spend a large proportion of time in the MPI_Alltoallv routine.
As can be seen from the plots below the modifications to the MPI_Alltoallv routines do not give any real improvement on the HECToR phase 2a XT4 system. In fact, the modifications have a detrimental effect on performance for the large system in benchmark 5at high core counts.
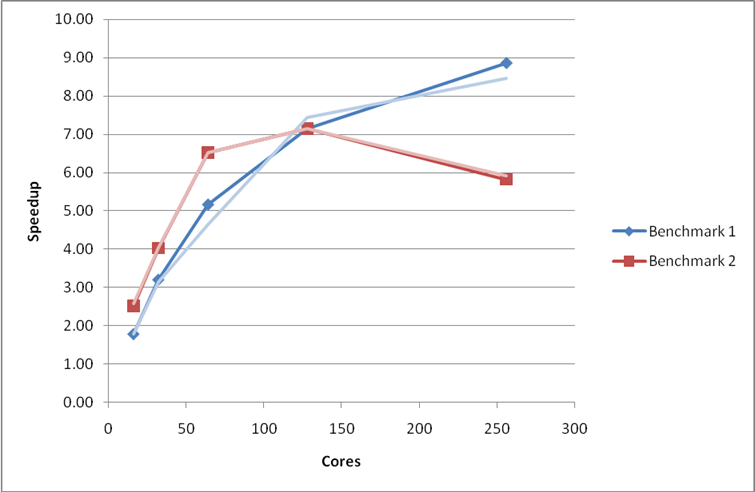
Figure 11: Performance and scaling of the small MCC VASP benchmarks for the code with shared memory optimisations in the MPI_Alltoallv operations. Using the G-point only code.
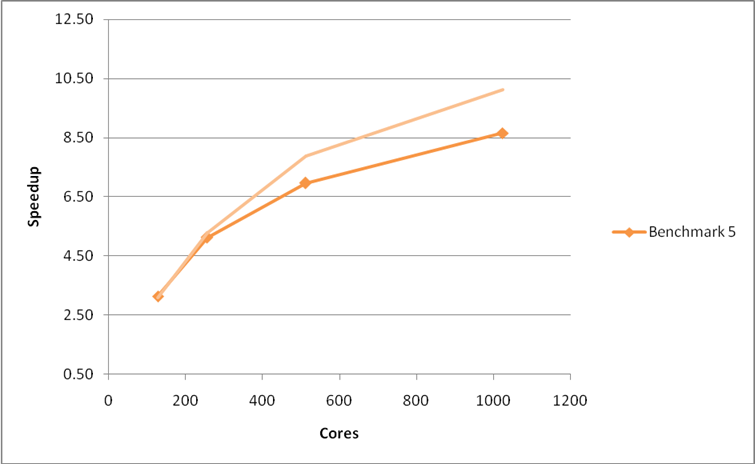
Figure 12: Performance and scaling of the large MCC VASP benchmark for the code with shared memory optimisations in the MPI_Alltoallv operations. Using the G-point only code.
The profiling results (Table 12) reveal that there is no longer a large amount of time spent in the MPI_Alltoallv routine in Benchmark 1 at 256 cores. As we have seen above, this change in the profile does not lead to any performance or scaling improvements on the XT4 system.
|
64 Cores |
256 Cores |
|
|
|
% Sample Time |
Routine Name/Group |
% Sample Time |
Routine Name/Group |
|
41.20% |
User Routines |
64.70% |
MPI Routines |
|
6.50% |
fpassm_ |
18.80% |
mpi_barrier_ |
|
4.50% |
vhamil_ |
17.90% |
mpi_allreduce_ |
|
3.90% |
ipassm_ |
13.60% |
MPI_Bcast
(ScaL) |
|
3.20% |
racc0mu_ |
6.30% |
mpi_alltoall_ |
|
2.80% |
fftwav_mpi_ |
3.50% |
mpi_bcast_ |
|
38.00% |
MPI Routines |
2.70% |
MPI_Recv
(ScaL) |
|
13.30% |
mpi_barrier_ |
21.00% |
User Routines |
|
9.70% |
mpi_allreduce_ |
2.90% |
fpassm_ |
|
6.90% |
mpi_alltoall_ |
2.00% |
vhamil_ |
|
3.90% |
MPI_Bcast
(ScaL) |
14.30% |
Library Routines |
|
20.90% |
Library Routines |
3.10% |
__c_mzero8 |
|
3.80% |
dgemv_t |
2.00% |
dgemv_t |
|
3.70% |
dgemm_otcopy |
|
|
|
2.10% |
daxpy_k |
|
|
|
2.00% |
__c_mzero8 |
|
|
|
Table 12: CrayPAT sampling results for code with the MPI_Alltoallv shared memory routines, benchmark 1 on 64 and 256 cores. |
|
512 Cores |
|
|
% Sample Time |
Routine Name/Group |
|
34.80% |
MPI Routines |
|
24.40% |
mpi_allreduce_ |
|
4.50% |
mpi_bcast_ |
|
2.00% |
MPI_Bcast (ScaL) |
|
33.40% |
Library Routines |
|
13.80% |
dgemv_t |
|
9.80% |
dgemv_n |
|
3.80% |
__fvdsincos |
|
31.80% |
User Routines |
|
17.20% |
nonl_fornl_ |
|
4.70% |
crexp_mul_wave_ |
|
3.10% |
work_mul_crexp_ |
|
Table 13: CrayPAT sampling results for code with the MPI_Alltoallv shared memory routines, benchmark 5 on 512 cores. |
If we rerun the calculations for the large benchmark 5 on the HECToR phase 2b XT6 system we see that the shared memory modifications give a real increase in performance for the VASP 5.2.2 code but do not provide any improvement in the scaling (Figure 13).
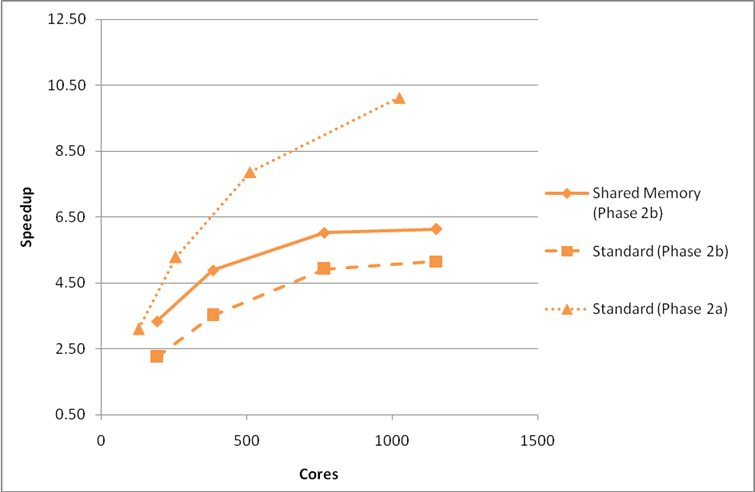
Figure 13: Comparison of performance on HECToR phase 2a and phase 2b (with and without shared memory optimisations) for benchmark 5. Using the G-point only code.All nodes fully-packed.
As there are more cores attached to a single network interface on phase 2b (24 cores) compared to phase 2a (4 cores) there is more contention for off-node network access. The shared-memory optimisations reduce this competition and improve the code performance marginally.
Final Performance and Profiling
Our final, optimised version of the VASP 5.2.2 code on the HECToR phase 2a XT4 system includes all of the modifications outlined above except for the shared-memory modifications to the MPI_Alltoallv routines. These are left out as they both degrade performance andalso introduce additional restrictions on the value of NPAR that can be selected by the VASP user and so reduce the flexibility of the VASP parallel performance that is such an excellent feature of the code. The shared-memory modifications also increase the likelihood that the code will crash with a memory error leading to wasted HECToR resources by the user. For the small benchmarks, the performance of the final optimised version is slightly lower than the best version (which is the version without ScaLAPACK) but as the brief of this project was to provide optimisations for large VASP calculations at large numbers of cores the best performing code for Benchmark 5 was selected.
On HECToR phase 2b XT6 system a version of the VASP 5.2.2 code with the shared memory modifications has been provided for all licensed VASP users as the performance gains on this system often outweigh the disadvantages.
The plots and tables below summarise the performance gains on the MCC supplied benchmarks on the HECToR phase 2a system from this dCSE project.
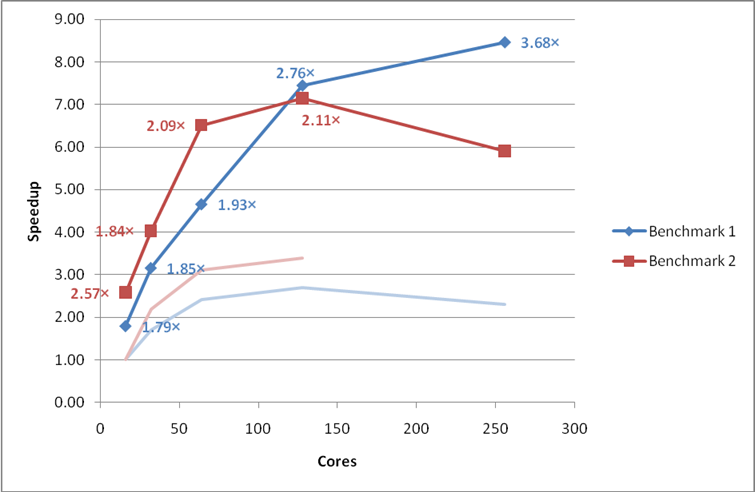
Figure 14: Final performance and scaling of the small MCC VASP benchmarks. Performance gains from the original version of VASP 5.2.2 are indicated as multiplicative factors next to each point. The faint lines indicate the original speedup curves. Using the G-point only code.
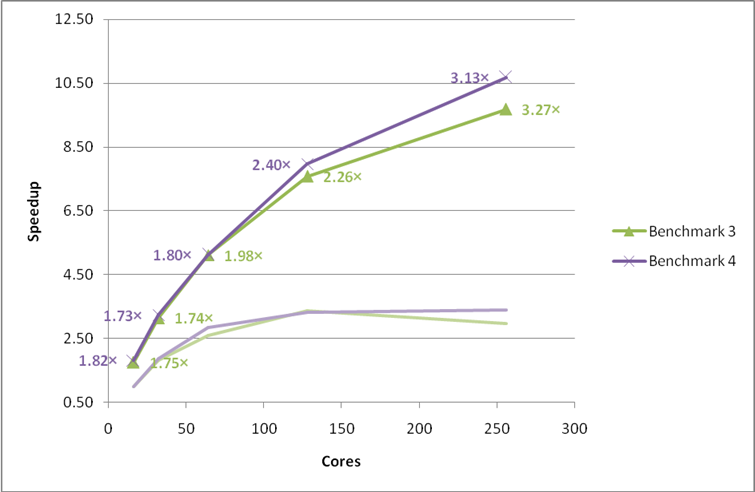
Figure 15: Final performance and scaling of the multiple k-point MCC VASP benchmarks. Performance gains from the original version of VASP 5.2.2 are indicated as multiplicative factors next to each point. The faint lines indicate the original speedup curves. Using the G-point only code.
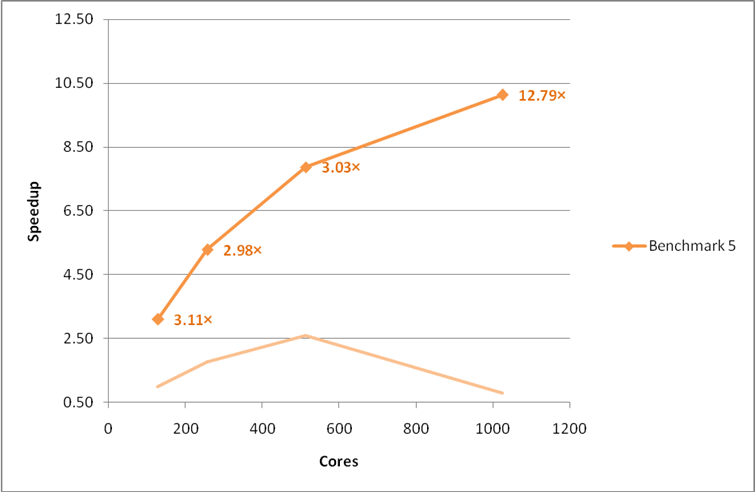
Figure 16: Final performance and scaling of the large MCC VASP benchmark. Performance gains from the original version of VASP 5.2.2 are indicated as multiplicative factors next to each point. The faint line indicates the original speedup curve. Using the G-point only code.
These benchmarks represent a variety of calculation types and we would expect all VASP users on HECToR to gain substantially from the improvement made.
The final profiles for benchmarks 1 and 5 are shown below and reveal the bottleneck to VASP scaling on the XT system is the performance of the PAW pseudopotential calculation (as indicated by the proportion of time spent in MPI_Allreduce).
|
64 Cores |
256 Cores |
|
|
|
% Sample Time |
Routine Name/Group |
% Sample Time |
Routine Name/Group |
|
44.10% |
User
Routines |
73.60% |
MPI
Routines |
|
7.30% |
fpassm_ |
20.60% |
mpi_alltoallv_ |
|
4.70% |
vhamil_ |
20.20% |
mpi_allreduce_ |
|
4.50% |
ipassm_ |
12.30% |
mpi_barrier_ |
|
3.40% |
racc0mu_ |
9.70% |
MPI_Bcast (ScaLapack) |
|
3.00% |
fftwav_mpi_ |
5.30% |
mpi_alltoall_ |
|
2.00% |
nonlr_rpromu_ |
2.80% |
mpi_bcast_ |
|
34.40% |
MPI
Routines |
15.10% |
User
Routines |
|
8.80% |
mpi_allreduce_ |
2.60% |
fpassm_ |
|
7.30% |
mpi_barrier_ |
11.40% |
Library
Routines |
|
6.30% |
mpi_alltoallv_ |
3.10% |
__c_mzero8 |
|
5.30% |
mpi_alltoall_ |
|
|
|
4.00% |
MPI_Bcast (ScaLapack) |
|
|
|
21.50% |
Library
Routines |
|
|
|
4.00% |
dgemv_t |
|
|
|
3.90% |
dgemm_otcopy |
|
|
|
2.30% |
daxpy_k |
|
|
|
2.10% |
__c_mzero8 |
|
|
|
2.00% |
dgemm_kernel |
|
|
|
Table 14: CrayPAT sampling results for the final version of the code, benchmark 1 on 64 and 256 cores. |
|
512 Cores |
|
|
% Sample
Time |
Routine Name/Group |
|
48.90% |
Library Routines |
|
23.90% |
dgemv_t |
|
17.70% |
dgemv_n |
|
2.60% |
__fvdsincos_gh |
|
27.50% |
User Routines |
|
12.30% |
nonl_fornl_ |
|
6.40% |
crexp_mul_wave_ |
|
4.40% |
work_mul_crexp_ |
|
23.60% |
MPI Routines |
|
16.00% |
mpi_allreduce_ |
|
2.80% |
mpi_bcast_ |
|
Table 15: CrayPAT sampling results for the final version of the code, benchmark 5 on 512 cores. |
Conclusions and Further Work
This project has exceeded the aims set out in the project plan to improve the performance and scaling of the VASP 5.2.2 code with speedups of between 3.11× and 12.79× at 256 cores and above for the supplied benchmarks. The improvements have been made available to all HECToR users via central installations on both the phase 2a and phase 2b systems. On the phase 2b system a version that includes shared memory optimisations for the MPI_Alltoallv routines is also included.
Due to the reduction in allocated resource from what was requested in the initial project proposal we have not been able to investigate the gains that could be made by introducing further optimisations to the collective communications routines via a dedicated library.
The major barrier to scaling of the VASP 5.2 code is the by-atoms parallelisation strategy used for the PAW pseudopotential calculation. The development of these routines is beyond the scope of this project and will be the subject of a future dCSE application.
Acknowledgement
This project was funded under the HECToR Distributed Computational Science and Engineering (CSE) Service operated by NAG Ltd. HECToR - A Research Councils UK High End Computing Service - is the UK's national supercomputing service, managed by EPSRC on behalf of the participating Research Councils. Its mission is to support capability science and engineering in UK academia. The HECToR supercomputers are managed by UoE HPCx Ltd and the CSE Support Service is provided by NAG Ltd. http://www.hector.ac.uk
Appendix A: Performance Data
Original version
|
|
|
Time / s |
|
|
|
Cores |
NPAR |
Run #1 |
Run #2 |
Speedup |
|
16 |
2 |
186 |
186 |
1.00 |
|
32 |
4 |
109 |
109 |
1.71 |
|
64 |
8 |
79 |
77 |
2.42 |
|
128 |
8 |
69 |
70 |
2.70 |
|
256 |
16 |
81 |
89 |
2.30 |
Table 16: Performance data for benchmark 1 using the original version of VASP. Speedup is relative to run time at 16 cores.
|
|
|
Time / s |
|
|
|
Cores |
NPAR |
Run #1 |
Run #2 |
Speedup |
|
16 |
16 |
4130 |
4043 |
1.00 |
|
32 |
32 |
1848 |
1882 |
2.19 |
|
64 |
64 |
1331 |
1300 |
3.11 |
|
128 |
128 |
1204 |
1194 |
3.39 |
|
256 |
256 |
Fail |
Fail |
|
Table 17: Performance data for benchmark 2 using the original version of VASP. Speedup is relative to run time at 16 cores.
|
|
|
Time / s |
|
|
|
Cores |
NPAR |
Run #1 |
Run #2 |
Speedup |
|
16 |
4 |
1714 |
1716 |
1.00 |
|
32 |
4 |
948 |
949 |
1.81 |
|
64 |
4 |
663 |
665 |
2.59 |
|
128 |
8 |
510 |
514 |
3.36 |
|
256 |
16 |
665 |
578 |
2.97 |
Table 18: Performance data for benchmark 3 using the original version of VASP. Speedup is relative to run time at 16 cores.
|
|
|
Time / s |
|
|
|
Cores |
NPAR |
Run #1 |
Run #2 |
Speedup |
|
16 |
2 |
20277 |
20245 |
1.00 |
|
32 |
4 |
10830 |
10814 |
1.87 |
|
64 |
8 |
7178 |
7104 |
2.85 |
|
128 |
8 |
6153 |
6098 |
3.32 |
|
256 |
16 |
6009 |
5939 |
3.41 |
Table 19: Performance data for benchmark 4 using the original version of VASP. Speedup is relative to run time at 16 cores.
|
|
|
Time / s |
|
|
|
Cores |
NPAR |
Run #1 |
Run #2 |
Speedup |
|
128 |
2 |
4520 |
4456 |
1.00 |
|
256 |
8 |
2576 |
2515 |
1.77 |
|
512 |
32 |
1851 |
1717 |
2.60 |
|
1024 |
32 |
6040 |
5628 |
0.79 |
Table 20: Performance data for benchmark 5 using the original version of VASP. Speedup is relative to run time at 128 cores.
Enforcing use of MPI collectives
|
|
|
Time / s |
|
|
|
Cores |
NPAR |
Run #1 |
Run #2 |
Speedup |
|
16 |
2 |
164 |
161 |
1.16 |
|
32 |
4 |
93 |
96 |
2.00 |
|
64 |
8 |
63 |
61 |
3.05 |
|
128 |
16 |
47 |
46 |
4.04 |
|
256 |
32 |
39 |
38 |
4.89 |
Table 21: Performance data for benchmark 1 on HECToR phase 2a with the use of MPI collective communication routines enforced. Using the G-point only code. Speedup is relative to the original run time at 16 cores.
|
|
|
Time / s |
|
|
|
Cores |
NPAR |
Run #1 |
Run #2 |
Speedup |
|
16 |
16 |
2878 |
2882 |
1.40 |
|
32 |
32 |
1636 |
1638 |
2.47 |
|
64 |
64 |
1216 |
1249 |
3.32 |
|
128 |
128 |
1090 |
1084 |
3.73 |
|
256 |
256 |
Fail |
Fail |
|
Table 22: Performance data for benchmark 2 on HECToR phase 2a with the use of MPI collective communication routines enforced. Using the G-point only code. Speedup is relative to the original run time at 16 cores.
|
|
|
Time / s |
|
|
|
Cores |
NPAR |
Run #1 |
Run #2 |
Speedup |
|
128 |
4 |
1600 |
1557 |
2.86 |
|
256 |
8 |
997 |
983 |
4.53 |
|
512 |
32 |
716 |
685 |
6.51 |
|
1024 |
32 |
568 |
562 |
7.93 |
Table 23: Performance data for benchmark 5 on HECToR phase 2a with the use of MPI collective communication routines enforced. Using the G-point only code. Speedup is relative to the original run time at 16 cores.
|
|
|
Time / s |
|
|
|
Cores |
NPAR |
Run #1 |
Run #2 |
Speedup |
|
16 |
2 |
159 |
159 |
1.17 |
|
32 |
4 |
94 |
95 |
1.98 |
|
64 |
8 |
60 |
61 |
3.10 |
|
128 |
16 |
44 |
45 |
4.23 |
|
256 |
32 |
36 |
37 |
5.17 |
Table 24: Performance data for benchmark 1 on HECToR phase 2a with MPI_Allreduce used in the PAW pseudopotential calculation. Using the G-point only code. Speedup is relative to the original run time at 16 cores.
|
|
|
Time / s |
|
|
|
Cores |
NPAR |
Run #1 |
Run #2 |
Speedup |
|
16 |
16 |
1597 |
1588 |
2.55 |
|
32 |
32 |
1020 |
1010 |
4.00 |
|
64 |
64 |
635 |
625 |
6.47 |
|
128 |
128 |
584 |
575 |
7.03 |
|
256 |
256 |
702 |
709 |
5.76 |
Table 25: Performance data for benchmark 2 on HECToR phase 2a with MPI_Allreduce used in the PAW pseudopotential calculation. Using the G-point only code. Speedup is relative to the original run time at 16 cores.
|
|
|
Time / s |
|
|
|
Cores |
NPAR |
Run #1 |
Run #2 |
Speedup |
|
128 |
4 |
1468 |
1490 |
3.04 |
|
256 |
8 |
977 |
934 |
4.77 |
|
512 |
32 |
708 |
658 |
6.77 |
|
1024 |
32 |
508 |
548 |
8.77 |
Table 26: Performance data for benchmark 5 on HECToR phase 2a with MPI_Allreduce used in the PAW pseudopotential calculation. Using the G-point only code. Speedup is relative to the original run time at 16 cores.
Remove array zeroing operations
|
|
|
Time / s |
|
|
|
Cores |
NPAR |
Run #1 |
Run #2 |
Speedup |
|
16 |
2 |
104 |
104 |
1.79 |
|
32 |
4 |
58 |
58 |
3.21 |
|
64 |
8 |
35 |
36 |
5.31 |
|
128 |
16 |
23 |
28 |
8.09 |
|
256 |
32 |
18 |
22 |
10.33 |
Table 27: Performance data for benchmark 1 on HECToR phase 2a with array zeroing operations removed. Using the G-point only code. Speedup is relative to the original run time at 16 cores.
|
|
|
Time / s |
|
|
|
Cores |
NPAR |
Run #1 |
Run #2 |
Speedup |
|
16 |
16 |
1561 |
1558 |
2.59 |
|
32 |
32 |
991 |
985 |
4.10 |
|
64 |
64 |
608 |
606 |
6.67 |
|
128 |
128 |
553 |
550 |
7.35 |
|
256 |
256 |
671 |
680 |
6.03 |
Table 28: Performance data for benchmark 2 on HECToR phase 2a with array zeroing operations removed Using the G-point only code. Speedup is relative to the original run time at 16 cores.
|
|
|
Time / s |
|
|
|
Cores |
NPAR |
Run #1 |
Run #2 |
Speedup |
|
128 |
4 |
1486 |
1492 |
3.00 |
|
256 |
8 |
925 |
924 |
4.82 |
|
512 |
32 |
661 |
675 |
6.74 |
|
1024 |
32 |
540 |
562 |
8.25 |
Table 29: Performance data for benchmark 5 on HECToR phase 2a with array zeroing operations removed. Using the G-point only code. Speedup is relative to the original run time at 16 cores.
Introduce ScaLAPACK for linear algebra
|
|
|
Time / s |
|
|
|
Cores |
NPAR |
Run #1 |
Run #2 |
Speedup |
|
16 |
2 |
106 |
104 |
1.79 |
|
32 |
4 |
60 |
59 |
3.15 |
|
64 |
8 |
49 |
40 |
4.65 |
|
128 |
16 |
25 |
25 |
7.44 |
|
256 |
32 |
22 |
23 |
8.45 |
Table 30: Performance data for benchmark 1 on HECToR phase 2ausing ScaLAPACK for the linear algebra operation. Using the G-point only code.. Speedup is relative to the original run time at 16 cores.
|
|
|
Time / s |
|
|
|
Cores |
NPAR |
Run #1 |
Run #2 |
Speedup |
|
16 |
16 |
1571 |
1604 |
2.57 |
|
32 |
32 |
1004 |
1015 |
4.03 |
|
64 |
64 |
621 |
628 |
6.51 |
|
128 |
128 |
566 |
573 |
7.14 |
|
256 |
256 |
685 |
703 |
5.90 |
Table 31: Performance data for benchmark 2 on HECToR phase 2ausing ScaLAPACK for the linear algebra operation. Using the G-point only code.. Speedup is relative to the original run time at 16 cores.
|
|
|
Time / s |
|
|
|
Cores |
NPAR |
Run #1 |
Run #2 |
Speedup |
|
128 |
4 |
1435 |
1435 |
3.11 |
|
256 |
8 |
860 |
843 |
5.29 |
|
512 |
32 |
577 |
566 |
7.87 |
|
1024 |
32 |
440 |
480 |
10.13 |
Table 32: Performance data for benchmark 5 on HECToR phase 2ausing ScaLAPACK for the linear algebra operation. Using the G-point only code.. Speedup is relative to the original run time at 16 cores.
Include shared-memory modifications for MPI_Alltoallv
|
|
|
Time / s |
|
|
|
Cores |
NPAR |
Run #1 |
Run #2 |
Speedup |
|
16 |
2 |
104 |
104 |
1.79 |
|
32 |
4 |
59 |
58 |
3.21 |
|
64 |
8 |
36 |
36 |
5.17 |
|
128 |
16 |
27 |
26 |
7.15 |
|
256 |
32 |
21 |
21 |
8.86 |
Table 33: Performance data for benchmark 1 on HECToR phase 2awith shared memory optimisations in the MPI_Alltoallv operations. Using the G-point only code. Speedup is relative to the original run time at 16 cores.
|
|
|
Time / s |
|
|
|
Cores |
NPAR |
Run #1 |
Run #2 |
Speedup |
|
16 |
16 |
1612 |
1609 |
2.51 |
|
32 |
32 |
1010 |
1005 |
4.02 |
|
64 |
64 |
639 |
621 |
6.51 |
|
128 |
128 |
566 |
567 |
7.14 |
|
256 |
256 |
695 |
705 |
5.82 |
Table 34: Performance data for benchmark 2 on HECToR phase 2awith shared memory optimisations in the MPI_Alltoallv operations. Using the G-point only code. Speedup is relative to the original run time at 16 cores.
|
|
|
Time / s |
|
|
|
Cores |
NPAR |
Run #1 |
Run #2 |
Speedup |
|
128 |
4 |
1449 |
1420 |
3.14 |
|
256 |
8 |
868 |
869 |
5.13 |
|
512 |
32 |
643 |
640 |
6.96 |
|
1024 |
32 |
520 |
515 |
8.65 |
Table 35: Performance data for benchmark 5 on HECToR phase 2awith shared memory optimisations in the MPI_Alltoallv operations. Using the G-point only code. Speedup is relative to the original run time at 16 cores.
Final optimised version
|
|
|
Time / s |
|
|
|
Cores |
NPAR |
Run #1 |
Run #2 |
Improvement |
|
16 |
2 |
106 |
104 |
1.79 |
|
32 |
4 |
60 |
59 |
1.85 |
|
64 |
8 |
49 |
40 |
1.93 |
|
128 |
16 |
25 |
25 |
2.76 |
|
256 |
32 |
22 |
23 |
3.68 |
Table 36: Final performance data for benchmark 1. Improvement is relative to run time using original version of VASP.
|
|
|
Time / s |
|
|
|
Cores |
NPAR |
Run #1 |
Run #2 |
Improvement |
|
16 |
16 |
1571 |
1604 |
2.57 |
|
32 |
32 |
1004 |
1015 |
1.84 |
|
64 |
64 |
621 |
628 |
2.09 |
|
128 |
128 |
566 |
573 |
2.11 |
|
256 |
256 |
685 |
703 |
NA |
Table 37: Final performance data for benchmark 2.Improvement is relative to run time using original version of VASP. Original version failed at 256 cores.
|
|
|
Time / s |
|
|
|
Cores |
NPAR |
Run #1 |
Run #2 |
Improvement |
|
16 |
2 |
977 |
978 |
1.75 |
|
32 |
4 |
545 |
548 |
1.74 |
|
64 |
8 |
335 |
338 |
1.98 |
|
128 |
16 |
226 |
226 |
2.26 |
|
256 |
32 |
177 |
177 |
3.27 |
Table 38: Final performance data for benchmark 3.Improvement is relative to run time using original version of VASP.
|
|
|
Time / s |
|
|
|
Cores |
NPAR |
Run #1 |
Run #2 |
Improvement |
|
16 |
2 |
11344 |
11144 |
1.82 |
|
32 |
4 |
6429 |
6255 |
1.73 |
|
64 |
8 |
3947 |
4065 |
1.80 |
|
128 |
16 |
2541 |
2552 |
2.40 |
|
256 |
32 |
1972 |
1895 |
3.13 |
Table 39: Final performance data for benchmark .Improvement is relative to run time using original version of VASP.
|
|
|
Time / s |
|
|
|
Cores |
NPAR |
Run #1 |
Run #2 |
Improvement |
|
128 |
4 |
1435 |
1435 |
3.11 |
|
256 |
8 |
860 |
843 |
2.98 |
|
512 |
32 |
577 |
566 |
3.03 |
|
1024 |
32 |
440 |
480 |
12.79 |
Table 40: Final performance data for benchmark 5.Improvement is relative to run time using original version of VASP.
Appendix B: Selecting NPAR
Experiences of choosing number of cores and NPAR for VASP 5.2 on HECToR
A. R. Turner, EPCC, University of Edinburgh, 14 May 2010
This document summarises the experience I have had in running VASP 5.2 on HECToR. It may be of some use in helping to select the number of cores you should run on and the value of the VASP parameter NPAR.
Note: I do not provide any guidance beyond that available in the VASP manual on whether to set LPLANE to TRUE or FALSE.
Note: All the benchmarks I have used use the PAW method to describe the core electrons so I have not evaluated the performance of the US pseuopotential method.
Note: All runs were performed using the version of VASP 5.2 that can be accessed by loading the vasp5/5.2_dev module on HECToR Phase 2a.
Benchmark Systems
Bench 1: Li defect in ZnO (GGA)
· G-point
· 64 atoms
· GGA functional
· Single-point SCF
Bench 2: Li defect in ZnO (Hybrid-DFT)
· G-point
· 64 atoms
· GGA functional
· Single-point SCF
Bench 3: TiO2 5×5×5 Supercell
· G-point
· 750 atoms
· GGA functional
· 6 SCF cycles
Results
Bench 1: Li defect in ZnO (GGA)
G-point code. For this calculation I would recommend using 128 cores and NPAR = 16.
|
Cores |
NPAR |
Time / s |
|
16 |
1 |
115 |
|
16 |
2 |
106 |
|
16 |
4 |
123 |
|
32 |
2 |
63 |
|
32 |
4 |
60 |
|
32 |
8 |
68 |
|
64 |
2 |
59 |
|
64 |
4 |
41 |
|
64 |
8 |
49 |
|
128 |
8 |
46 |
|
128 |
16 |
25 |
|
128 |
32 |
29 |
|
256 |
16 |
25 |
|
256 |
32 |
22 |
|
256 |
64 |
25 |
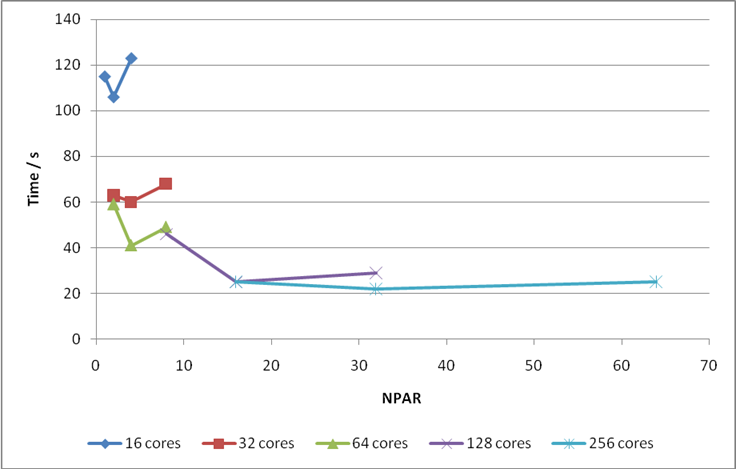
Figure 17: Values of NPAR versus time to solution for various numbers of cores for Bench 1.
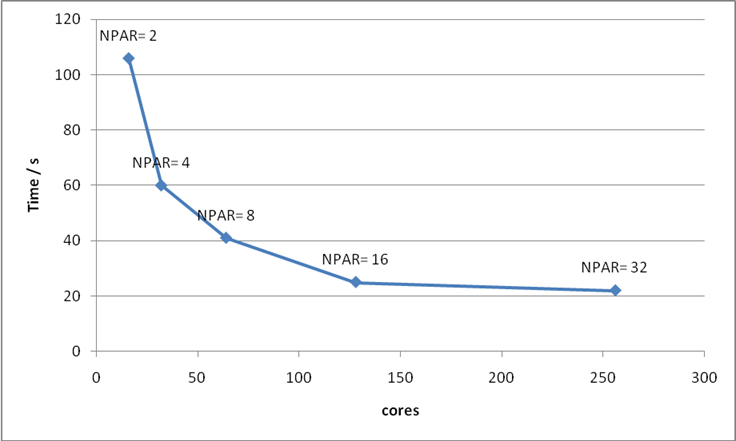
Figure 18: Plot of number of cores versus time to solution for Bench 1. The optimum value of NPAR is indicated for each point.
Bench 2: Li defect in ZnO (Hybrid-DFT)
G-point code. For this calculation I would recommend using 64 cores.
Note: you cannot change the value of NPAR for hybrid functional calculations; it is fixed at the number of cores.
|
Cores |
NPAR |
Time / s |
|
16 |
16 |
1571 |
|
32 |
32 |
1004 |
|
64 |
64 |
621 |
|
128 |
128 |
566 |
|
256 |
256 |
671 |
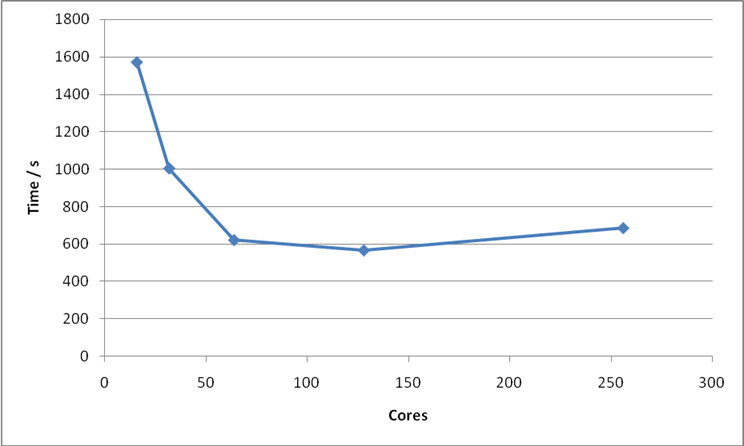
Figure 19: Plot of number of cores versus time to solution for Bench 2.
Bench 3: TiO2 5×5×5 Supercell
G-point code. For this calculation I would recommend using 512 cores and NPAR = 32.
|
Cores |
NPAR |
Time / s |
|
128 |
2 |
1530 |
|
128 |
4 |
1435 |
|
128 |
8 |
1584 |
|
128 |
16 |
2662 |
|
256 |
8 |
852 |
|
256 |
16 |
870 |
|
256 |
32 |
1423 |
|
512 |
16 |
624 |
|
512 |
32 |
572 |
|
512 |
64 |
850 |
|
1024 |
16 |
483 |
|
1024 |
32 |
460 |
|
1024 |
64 |
475 |
|
1024 |
128 |
591 |
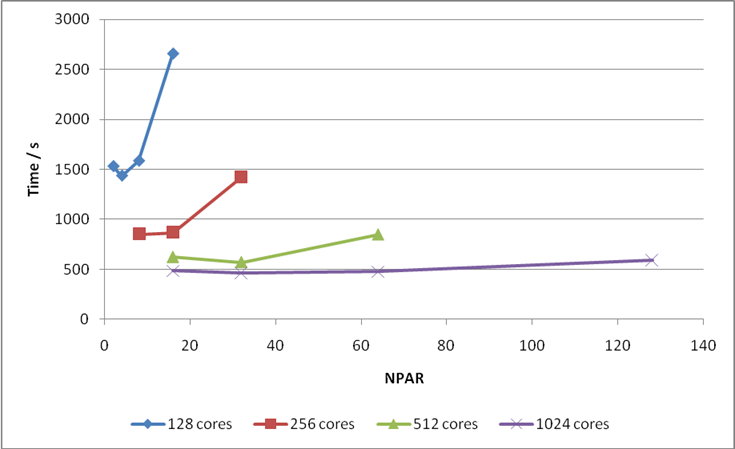
Figure 20: Values of NPAR versus time to solution for various numbers of cores for Bench 3.
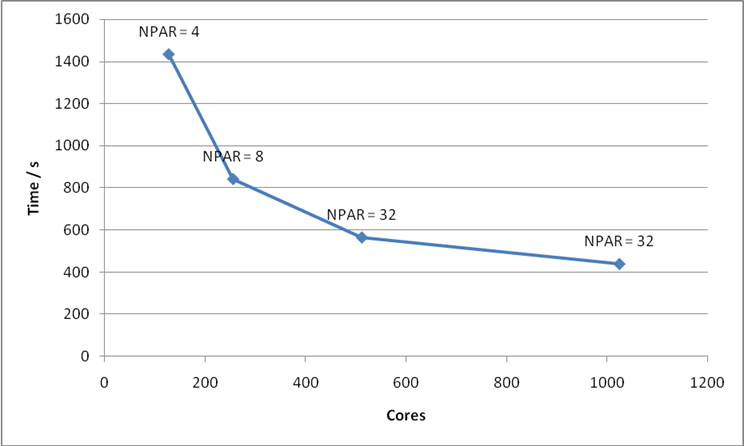
Figure 21: Plot of number of cores versus time to solution for Bench 3. The optimum value of NPAR is indicated for each point.
Summary
· PAW calculations in VASP 5.2 do not scale well when (number of cores) >> (number of atoms) as the PAW calculation is parallelised over number of atoms.
· Value of NPAR depends on size of system you are studying and the number of cores you are running on.
Here are some tentative guidelines for running VASP 5.2 on HECToR efficiently:
· If you can test to find the optimal NPAR value with a single SCF cycle you should do this.
· The more cores you are using the less critical the value of NPAR becomes.
· For the smaller benchmarks (32 and 64 atoms) a good rule of thumb seems to be to choose NPAR = (number of cores) / 8.
· For the larger benchmark (750 atoms) the rules are not so clear cut but a good starting point would be NPAR = (number of cores) / (16 or 32).