|
 |
 |
|
|
|
|
| Project Title | SPRINTing with HECToR |
| Document Title | SPRINT – D3.2 Final project report |
| Authorship | Savvas Petrou (SP) |
| Document Filename | SPRINT-D3.2_Final__report |
| Document Version | v1.0 |
| Distribution Classification | DPM-EPCC-NAG-Internal |
| Distribution List | Project Board; Project Team; NAG |
| Approval List | Project Board |
Abstract
In this report the outcome of the distributed Computer Science and Engineering (dCSE) project “SPRINTing with HECToR” is presented. The objective of the project was to port the SPRINT R package on HECToR and implement two parallel functions that perform well for process counts of up to 512.
In the first work package the performance of an already parallelised version of a correlation function was investigated. After identifying the bottlenecks a new parallel implementation was developed. The new version takes advantage of the high performance file system on HECToR to solve the bottlenecks of the original implementation. The second work package parallelises a permutation testing function. A suitable serial implementation was first identified and then extensively analysed. A parallel approach was then implemented.
The benchmarks performed on the HECToR system showed very good scaling behaviour for both functions.
As mentioned in the dCSE [1] proposal ‘SPRINTing with HECToR‘ [2], the analysis of genetic data requires large amounts of computational processing power and memory to complete. The last few years have seen the widespread introduction of high throughput and highly parallel experiments in biological research. Microarray-based techniques are a prominent example, allowing for simultaneous measurement of thousands to millions of genes or sequences across tens to thousands of different samples. These studies generate an unprecedented amount of data and test the limits of existing bioinformatics computing infrastructure. Emerging whole genome associative studies and clinical projects will require from several hundreds to several thousands of microarray experiments. Microarray experiment repositories such as GPX-MEA [3] and ArrayExpress [4] are continuously growing in size but the research community is lacking the computing resources to analyse and extract novel scientific knowledge from the data contained in these databases. This trend is expected to continue as advances in technology are continually contributing to an increase in the amount of data to be analysed. Increase in coverage allows for more gene sequences to be analysed on one single array. The reducing cost of this technology has also fuelled its popularity. As a consequence an even larger amount of data is being produced. A popular free statistical software package for carrying out the data analysis is R [5]. R was identified as one of the key pieces of code used by the Bio Life Sciences in a recent BBSRC [6] consultation.
Recently, EPCC [7] along with the Division of Pathway Medicine (DPM) [8], designed and built a prototype package for R, called SPRINT [9], which parallelised a key statistical function of use to genomic analysis [10]. This prototype successfully demonstrated that parallelised statistical functions could be interfaced with R, providing biologists with an easy route into HPC. The aim of SPRINT is to require minimal HPC knowledge, minimal changes to existing R scripts, and yet give maximum performance. SPRINT is written in C and MPI [11] and as such should be portable to a number of platforms, from multi-core desktops, University-scale clusters, to national HPC services, such as HECToR [12]. Whilst SPRINT was designed to run on a number of hardware platforms, porting SPRINT onto HECToR would be a big advantage and will facilitate future grant applications from a number of communities. We are and will publicise SPRINT heavily as part of existing projects and as a result SPRINT has already appeared in a number of publications [13, 14].
This dCSE project ported SPRINT to HECToR, optimised key routines, and added additional functionality. The purpose of this report is to present the outcome of the parallelisation and optimisation process of two parallel functions implemented for the SPRINT package. The aim of the first work package [15] was to investigate the scaling of the currently available parallel correlation function and implement a new version that scales for 512 processes. The second work package [16] aimed to implement a parallel version of a permutation testing function that also scales for 512 processes.
In Chapter 2 background information on R, SPRINT and the HECToR system are given. Chapter 3 explains how the SPRINT package can be installed on the HECToR system. In Chapters 4 and 5 the parallelisation of the two functions is explained in detail. The last chapter, Chapter 6, summarises the achievements and suggests future plans for the SPRINT project.
R is an interpreted programming language and a statistical environment. It is an open source GNU package which is similar to the S language and environment. Over the past few years the R community has grown significantly and many new libraries are developed and published on a monthly basis. In its current release, R offers no inbuilt parallel features, something that makes it difficult to use with HPC resources. In recent years, a few open source groups in the R community have got involved in an ongoing effort to develop packages [17, 18, 19, 20, 21] that enable parallelism in R. SPRINT is one of these packages.
The Simple Parallel R INTerface is an R package that offers both a parallel functions library and an interface for adding parallel functions to R. SPRINT started as a three month project in 2007 with the primary aim to prove that a package could offer easy access to HPC resources through the R language. The current project started in April 2009 and is a two years project funded by the Wellcome Trust [22]. Its primary target is to extend the functionality of SPRINT. The SPRINT project is a collaboration between two departments of the Edinburgh University, the Edinburgh Parallel Computing Centre (EPCC) [7] and the Division of Pathway Medicine (DPM) [8].
The SPRINT package is based on three components, the R statistical language package, the C language and the MPI parallel programming interface. Extending the currently available package requires the knowledge of all three.
For the tests and benchmarks of the new parallel functions the UK National Supercomputing service, the HECToR Cray XT system [12], was used. At the time of writing the configuration of the system (Phase2a) consists of 1416 compute blades, each having four quad core processor sockets. The CPUs used are AMD 2.3 GHz Opteron chips with 8 GB of memory. This gives a total of 22,656 active cores with a total of 45.3 TB of memory and a theoretical peak performance of 208 TFLOPS.
Additionally the system also incorporates a vector Cray X2 system. This system has 28 vector compute nodes, each having four Cray vector processors sharing 32 GB of memory. This gives a total of 112 vector processors and a total memory of 896 GB of memory. The theoretical performance of each Cray processor is 25 GFLOPS which gives a total of 2.87 TFLOPS.
On HECToR the R package (version 2.9.2) is available as a third party software. Unfortunately, in order to successfully compile and use SPRINT a new R installation is required. The back-end system has no support for the system shared libraries and the dynamic loading of SPRINT fails due to dependencies. These dependencies involve the MPI library and the Portals network protocol.
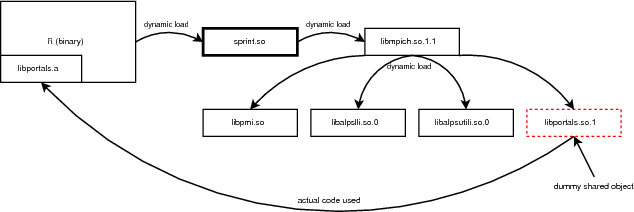
In more detail, the libportals.so.1 shared object is not currently available on HECToR. Moreover, the corresponding static library libportals.a can only be used to produce executables. Static libraries intended for use with shared objects must be compiled with the Position Independent Code (-fPIC) option enabled. The static library is not compiled with this option enabled and thus it cannot be used.
Figure 1 shows how the new R installation manages to resolve the static library issue by using the interpreter executable. When the executable is compiled the following options are passed to the GCC compiler :
-Wl,--whole-archive -L/opt/xt-service/2.1.56HDB/lib/snos64/ -lportals
These options will enforce the static library inside the interpreter executable and make it available to SPRINT. A dummy shared object is also needed in order to satisfy the shared object dependency when SPRINT is dynamically loaded. A detailed installation guide explaining how the R interpreter is compiled can be found on SPRINT website [9]. In the near future a new, compatible installation of R is expected to be available on HECToR which will also include SPRINT as a pre-installed library.
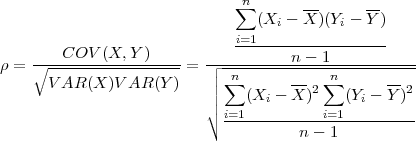
In the first SPRINT project [10] Hill et al made an attempt to parallelise the Pearson’s pair-wise correlation function (Eq. 1).
 | (1) |
The results from the benchmarks on the Edinburgh Compute and Data Facility [23] showed a poor scaling for executions with more than 4 processes. The first step performed in this dCSE project was to benchmark Hill’s parallel implementation of pcor on HECToR using the same datasets and parameters.
Hill et al’s implementation performs the following steps:
The benchmarks were executed with a dataset containing 11,001 rows (genes) and 320 columns (samples). In Table 1, the timings measured are shown. Figure 2 shows a graphical representation of the scaling.
| Process | Input data | Computational | Write to file |
| count | broadcast | kernel | |
| 1 | 0.028 | 103.824 | 240.810 |
| 2 | 0.052 | 54.890 | 240.119 |
| 4 | 0.075 | 31.317 | 241.812 |
| 8 | 0.096 | 16.861 | 241.709 |
| 16 | 0.137 | 9.980 | 241.475 |
| 32 | 0.147 | 6.589 | 241.671 |
| 64 | 0.168 | 4.888 | 241.680 |
| 128 | 0.186 | 4.259 | 242.276 |
| 256 | 0.197 | 4.188 | 241.406 |
| 512 | — | — | — |
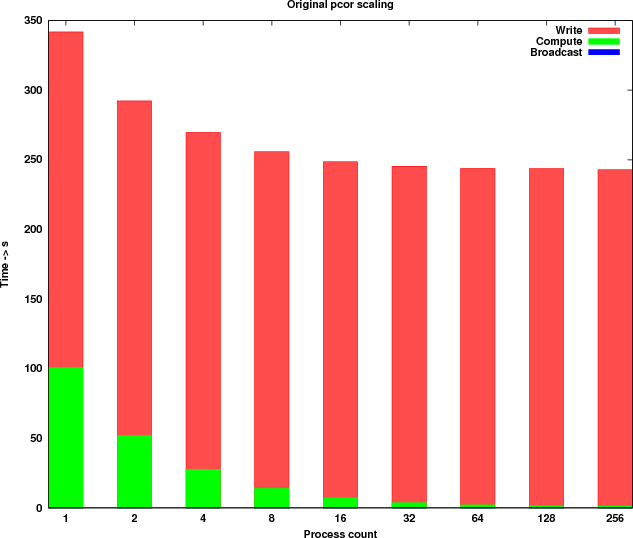
The observations drawn from there results are:
In addition to the previous list the following implementation observations where noted:
In this next section the parallelisation strategy is explained.
The writing of the output file in the original parallel implementation is carried out by the master process only. As mentioned earlier, the worker processes send their results to the master process after each work assignment is finished. The issues arising from this implementation are:
The solution is to take advantage of the parallel I/O support of the MPI [11] library. By introducing parallelism on the write process both issues can be addressed efficiently. The correlation coefficients will be stored locally on the worker processes and written into the file in parallel and collectively. The master process will no longer need to store the entire results array since the results will be distributed among the worker processes. The parallel write will take advantage of the high performance features of the Lustre file system on HECToR and reduce the time needed by the write out step. Moreover, it will scale as the number of processes increases until the point where the maximum I/O throughput of the underlying file system is reached.
MPI-I/O however, can only handle files in a binary format. By using binary representation MPI-I/O can locate, read and write values arbitrary in the file. It is also able to split the file into non overlapping sections among the worker processes and perform time and bandwidth efficient collective reads and writes. Both the C language and the R environment use the same binary representation of data thus the files created at C level using MPI-I/O can be handled using the R package binary file functions.
The writing out of the results into a file will enable the new implementation to process input arrays that produce large results arrays. By adding more worker processes the collective memory increases and thus more memory is available for storing results. However, the size of the input data has a limit. The memory available for storing correlation coefficients on each worker process depends on the size of the input. Equation 2 gives an estimate of the minimum number of worker processes needed in order to successfully process an input data set with dimensions (rows × col).
 | (2) |
Note: The memory is counted in bytes. All arrays/vectors contain double precision values (8 bytes).
The (col * col * 8) factor represents the size of the final results array. Factor (col * rows * 8) represents the size of the input data set and factor (col * 4 * 8) represents an estimate of all temporary memory needed. Dividing the size of the results array to the available, for results only, memory on each worker process, gives an estimate of how many workers are needed in order to have sufficient collective memory. When the size of the input dataset is large enough to occupy a significant amount of memory, the computation might not be possible. Nevertheless, the size of input dataset this new parallel implementation will be able handle is increased many times.
The theoretical minimum worker counts for a few input datasets can be seen in Table 2. The numbers apply to the current system configuration of HECToR (see Section 2.3).
| Input array | Final | Minimum No |
| dimensions and size | array size | of workers |
| 11,000 × 320 | 923.15MB | 1 |
| 26.85MB | 0.9GB | |
| 22, 000 × 320 | 3, 692.62MB | 2 |
| 53.7MB | 3.6GB | |
| 35,000 × 320 | 9,346MB | 6 |
| 85.44MB | 9.12GB | |
| 100,000 × 320 | 76,293.94MB | 47 |
| 244.14MB | 74.50GB | |
| 300,000 × 320 | 686,645.5MB | 590 |
| 732.42MB | 670.55GB | |
The ease of use of the binary output file was investigated. The R FF package [24] offers a memory mapped file support for the R environment. It uses the C library support for memory mapped files to open, read and write binary files. The structure of the binary files FF can manipulate is identical to the file structure created by the parallel implementation. This means that the output file created by MPI-I/O can easily be handled in R through the use of an FF object. When the writing of the final results array finishes, and the control returns back to the R environment, an FF object will be created and the handle returned to the user. Using this handle the user can read and write the contents of the file as if it was a normal R array in memory.
Based on the proposed parallel algorithm the necessary changes were made to the original parallel implementation. The correlation coefficients are now stored locally and written into the file in parallel at the end. The new implementation performs the following steps:
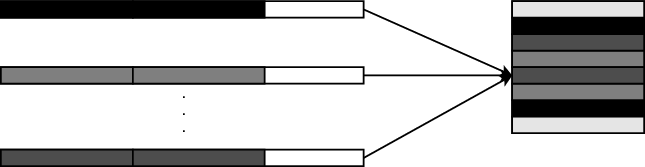
The worker processes store information on which rows they computed in order to be able to write them in the correct positions in the file. Figure 3 shows an example of how the local results map to various sections of the final output file. Using the MPI datatype MPI_Type_indexed, each process describes the sections of the file that its results map onto. Afterwards, a call to the MPI_File_write_all function will gather and write the results into the file collectively and in parallel.
The interface of the new parallel function is:
Compared to:
The optional parameters caching_ and filename_ are FF object parameters. If they are omitted the default values shown above will be used. When the filename_ parameter is omitted, a temporary file is created and later deleted when the FF object is closed.
The current parallel version of pcor implements one of the three correlation coefficients the serial cor function offers, the Pearson’s pair-wise correlation. The method parameter, which is used for choosing method, is thus not available in the parallel implementation. Moreover, there is no support for correlating the rows between two arrays. The y parameter, which is used to specify the second array, is also not available. The use parameter specifies the method for computing the correlation in the presence of missing values. This parameter is again not available in the current parallel version.
Following the success of the new parallel implementation, the remaining functionality of the correlation function will be added in future releases.
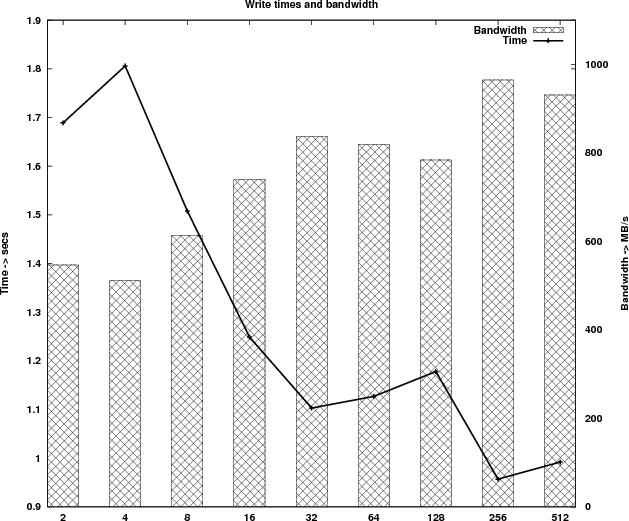
Table 3 shows the timings of the new implementation and Figure 4 shows the new runtime profile. Because of the parallel I/O the runtime profile has changed significantly. The computational kernel is now scaling linearly for process counts up to 512 and the time taken by the write process is reduced by more than 200 times.
| Process | Input data | Computational | Write to file |
| count | broadcast | kernel | |
| 1 | 0.028 | 100.402 | 0.013 |
| 2 | 0.049 | 54.498 | 1.689 |
| 4 | 0.074 | 34.228 | 1.806 |
| 8 | 0.097 | 17.159 | 1.508 |
| 16 | 0.113 | 8.594 | 1.249 |
| 32 | 0.141 | 4.321 | 1.103 |
| 64 | 0.177 | 2.179 | 1.127 |
| 128 | 0.179 | 1.114 | 1.178 |
| 256 | 0.191 | 0.555 | 0.957 |
| 512 | 0.213 | 0.305 | 0.992 |
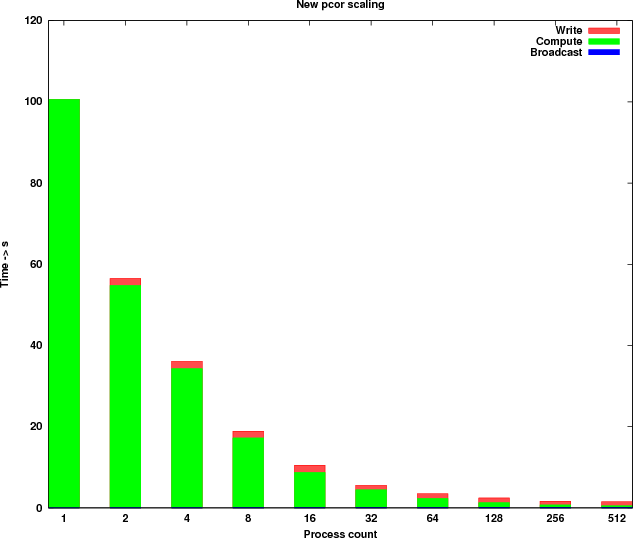
According to the write out timings measured, the 12 I/O nodes on HECToR can deliver a bandwidth of approximately 1 GB/s.
In addition, benchmarks were executed to test the size of input data set the new implementation can process. Table 4 shows the total run time of pcor for various input data sets. The produced final arrays are very large and cannot fit in a single processor memory. These executions fail to complete using the previous implementations of the correlation function due to memory limitations. All executions were performed with 256 processes.
This new parallel implementation is able to process data sets that were impossible to process using the previous parallel or serial version of the function. Moreover, the code takes a reasonable run time to perform the computations.
| Input array | Final array | Total runtime |
| dimension and size | dimension and size | (in seconds) |
| 35,000 × 320 | 35,000 × 35,000 | 36.64 |
| 85.44MB | 9.12GB | |
| 35, 000 × 3200 | 35, 000 × 35, 000 | 68.40 |
| 854.49MB | 9.12GB | |
| 35, 000 × 5000 | 35, 000 × 35, 000 | 98.46 |
| 1335.14MB | 9.12GB | |
| 45,000 × 320 | 45,000 × 45,000 | 40.18 |
| 109.86MB | 15.08GB | |
| 45,000 × 3200 | 45,000 × 45,000 | 123.79 |
| 1098.66MB | 15.08GB | |
| 45,000 × 5000 | 45,000 × 45,000 | 171.35 |
| 1716.61MB | 15.08GB | |
A permutation test is one of the statistical analysis methods used for measuring the statistical significance of data sets. It quantifies how likely it is to obtain data with the same properties as the one being tested, should the experiment be performed again. The serial function chosen to be parallelised in this dCSE project is the mt.maxT [25] function from the multtest [26] package. It computes the adjusted p-values for step-down multiple testing procedures, as they are described in Westfall and Young [27].
The main limiting factor of a permutation testing function is the count of permutations. As the count increases, the run time of the function becomes excessively costly. The precision of the statistical significance depends on the count of permutations. Ideally, one would like to perform the complete permutations of the data set in order to get a value as precise as possible. However, the count of complete permutations can get remarkably high for even small data sets (multiple millions or billions). For such a high count the serial implementation will need days to perform the complete permutations.
In Table 5 the estimated total run times for a few cases are shown. Executions with lower permutation counts (2000, 3000 and 5000) showed that the time taken by the function is increasing linearly as the count increases. According to these measurements the timings in Table 5 were estimated.
| Input array | Permutation | Serial runtime |
| dimension and size | count | (estimate) |
| (genes × samples) | (in seconds) | |
| 36,612 × 76 | 500,000 | 20,750 |
| 21.22MB | (6 hours) | |
| 36,612 × 76 | 1,000,000 | 41,500 |
| 21.22MB | (12 hours) | |
| 36,612 × 76 | 2,000,000 | 83,000 |
| 21.22MB | (23 hours) | |
| 73,224 × 76 | 500,000 | 35,000 |
| 42.45MB | (10 hours) | |
| 73,224 × 76 | 1,000,000 | 70,000 |
| 42.45MB | (20 hours) | |
| 73,224 × 76 | 2,000,000 | 140,000 |
| 42.45MB | (39 hours) | |
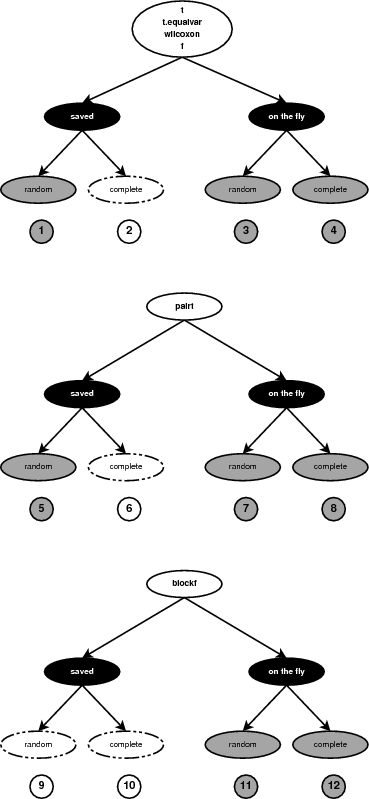
The mt.maxT function supports six statistic methods.
The serial code implements two permutation generators. One for random and one for complete permutations. Moreover, it supports six statistic methods, used for testing the null hypothesis of no-association between the class labels and the variables. Both generators are used with all six statistic methods. In addition, the user can choose whether to save the permutations in memory prior to the computations or compute them one at a time. Taking into consideration all options there are 24 combinations of generator/method/store. For four of the statistic methods the same generators can be used. Figure 6 shows how many combinations are implemented.
For a few of the cases (combinations 2, 6, 10 in Figure 6) the execution paths are identical. When the complete permutations generator is used, the implementation never saves the permutations in memory. Although the user can select this option, it is implemented using the on-the-fly generation of permutations. In a similar way, the permutations for the Block-F statistic method are never stored in memory either. The option is again available to the user but it is implemented using the on-the-fly generator. The number of distinct combinations implemented in the code are therefore eight (combinations 1, 3, 4, 5, 7, 8, 11 and 12 in Figure 6).
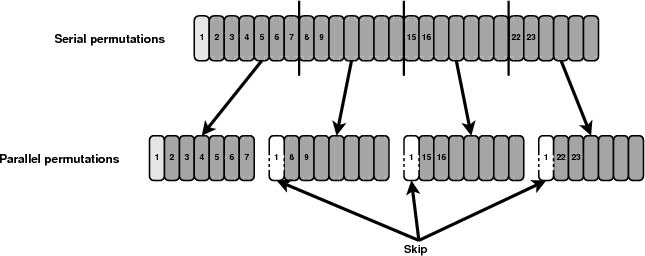
In order to produce the exact same results as the serial implementation the permutations performed by each process have to be selected with care. Figure 7 shows how the permutations are distributed among the available processes. The first permutation uses the initial labelling of columns and it should only be taken into account once by the master process. All other processes will skip this permutation. In addition, the generator on each process needs to be forwarded to the appropriate permutation. An additional variable will be passed to the initialisation function and depending on its value the generators will waste a number of cycles and initialise their generators to the appropriate permutation.
All processes will need to have a copy of the whole data set and also know the options the user selected. Before the computations take place, the data set and the user options will be broadcast to all processes. Moreover, at the end of the computational kernel the partial observations will be gathered on the master process. According to these observations the final p-values will be computed.
The parallel implementation performs the following steps:
The processes in this parallel implementation communicate only at the beginning of the function and at the end. When the main computational kernel executes, processes have no dependencies. The parallel version has an additional step between the pre-processing step and the call to the kernel. This new step broadcasts the data to all processes and it is also responsible for gathering the data and computing the final results.
The second major change was to make sure the generator is initialised correctly. The necessary changes on the generator interface were made and code was added for wasting cycles when needed. Code was also added to make sure that only the master process executes the first permutation the generator returns.
The interface of the pmaxT is identical to the interface of mt.maxT. All functionality was successfully ported to the parallel version:
Compared to:
Parameters test, side, fixed.seed.sampling, B, na and nonpara are optional. If omitted, the default values shown above are used. The description of the input parameters follows.
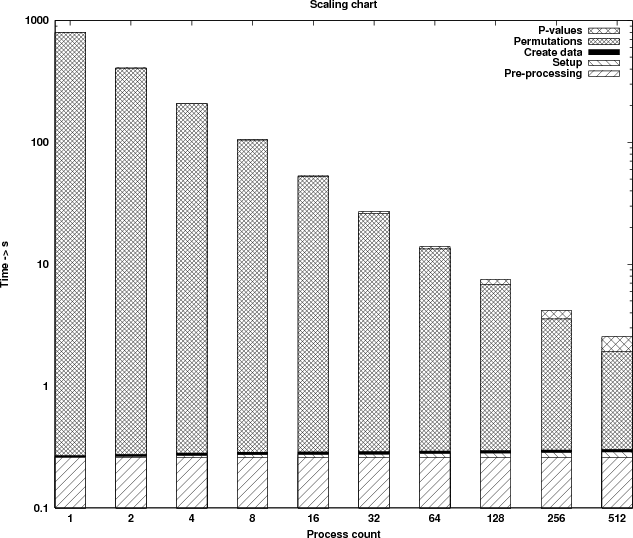
The first graph (Figure 8) shows the runtime profile of the parallel version. The graph is in logarithmic scale in order to be able to observe the behaviour of all sections timed, even the ones that consume very little time. The benchmarks are performed using a data set with 6102 rows (genes) and 76 columns (samples), executing a permutation count of 150,000. The results are shown in Table 6.
| Process | Pre-processing | Broadcast | Create data | Computational | p-values | Speedup | Speedup |
| count | parameters | kernel | computations | (computations) | |||
| 1 | 0.260 | 0.001 | 0.010 | 795.600 | 0.002 | 1.00 | 1.00 |
| 2 | 0.261 | 0.004 | 0.012 | 406.204 | 0.884 | 1.95 | 1.95 |
| 4 | 0.259 | 0.009 | 0.013 | 207.776 | 0.005 | 3.82 | 3.82 |
| 8 | 0.260 | 0.013 | 0.013 | 104.169 | 0.489 | 7.58 | 7.63 |
| 16 | 0.259 | 0.015 | 0.013 | 51.931 | 0.713 | 15.03 | 15.32 |
| 32 | 0.259 | 0.017 | 0.013 | 25.993 | 0.784 | 29.40 | 30.60 |
| 64 | 0.259 | 0.020 | 0.013 | 13.028 | 0.611 | 57.11 | 61.06 |
| 128 | 0.259 | 0.023 | 0.013 | 6.516 | 0.662 | 106.48 | 122.09 |
| 256 | 0.260 | 0.024 | 0.013 | 3.257 | 0.611 | 190.99 | 244.27 |
| 512 | 0.260 | 0.028 | 0.013 | 1.633 | 0.606 | 313.09 | 487.20 |
By examining the results it can be seen that the computational kernel alone (last column in Table 6) is scaling close to optimal. Two of the sections timed (columns 2 and 4) are executed in serial and thus consume a constant amount of time. For collective communications (columns 3 and 6) the time increases as more processes are used. However, the additional time needed as the process count doubles is very small due to the optimised implementation of the collective operations on HECToR.
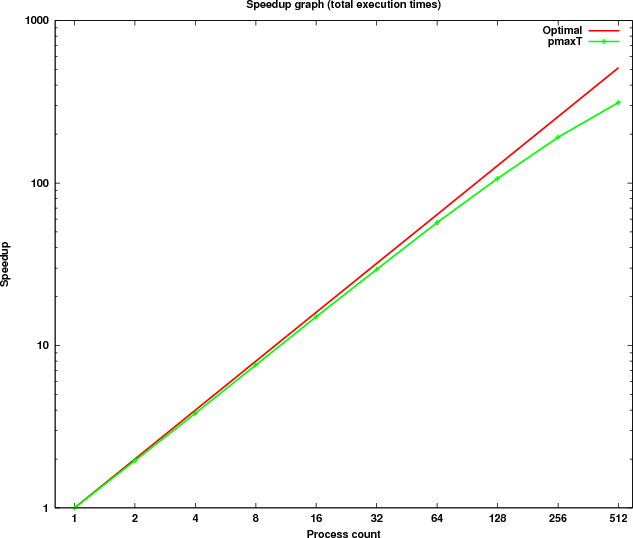
Figure 9 shows the scaling of the total execution time compared to the optimal speedup curve.
In addition, benchmarks were executed to measure the run time of the new parallel implementation when a very high permutation count is executed. Table 7 shows the timings measured. By examining the timings it can be seen that the process count is linearly related to the run time. The same relation is also observed between the row count and the run time.
| Input array | Permutation | Total runtime | Serial runtime |
| dimension and size | count | (in seconds) | (estimate) |
| (genes × samples) | (in seconds) | ||
| 36,612 × 76 | 500,000 | 73.18 | 20,750 |
| 21.22MB | (6 hours) | ||
| 36,612 × 76 | 1,000,000 | 146.64 | 41,500 |
| 21.22MB | (12 hours) | ||
| 36,612 × 76 | 2,000,000 | 290.22 | 83,000 |
| 21.22MB | (23 hours) | ||
| 73,224 × 76 | 500,000 | 148.46 | 35,000 |
| 42.45MB | (10 hours) | ||
| 73,224 × 76 | 1,000,000 | 294.61 | 70,000 |
| 42.45MB | (20 hours) | ||
| 73,224 × 76 | 2,000,000 | 591.48 | 140,000 |
| 42.45MB | (39 hours) | ||
Considering the objectives of the dCSE SPRINT project, we can say that the project is completed with success. The first step was to make sure that SPRINT is able to install and run on the HECToR system. After investigation a minor issue was identified and a solution found. An installation guide on how to compile the package was written and is available on the SPRINT project web site [9].
The first task after that was to analyse the performance of the original parallel version of the correlation function and implement a new version on HECToR which scales for up to 512 processes. After extensive profiling two bottlenecks were identified. The first was the file I/O and the second the fact that all results were gathered on the master process. By using the underlying high performance Lustre filesystem we managed to address both issues. The results are now distributed among all processes and written into the file at the end, collectively and in parallel.
The second task of the project was to parallelise a permutation testing function. After finding a suitable serial implementation, the code was analysed and a parallel version proposed. The parallelism is introduced by dividing the permutation count equally to the available processes. Each process gathers a few of the observations and at the end all partial observations are reduced on the master process. Using this information the p-values are computed.
Based on the benchmarks performed on the HECToR system, both functions are able to scale close to optimal for process counts up to 512. Statisticians can now use the parallel versions of these functions to process their large data sets and also get results within reasonable run times.
In addition to the primary objectives, the SPRINT team had the opportunity to present the work performed under the dCSE project in two occasions. The first presentation was given at the R User Group Meeting [28] and the second at the Data-Intensive Research Workshop [29]. Moreover, a paper was submitted and accepted to the Emerging Computational Methods for the Life Sciences Workshop [30] at the ACM International Symposium on High Performance Distributed Computing (HPDC) [31]. An abstract was also submitted and accepted to the useR! 2010 International Conference [32].
The source code of the SPRINT project is published under the GNU license and it is available for download on the project web site. An action for adding the package in the CRAN [33] public repository is under-way. Also, a newer version of the R package is going to be available soon on the HECToR system and it will provide SPRINT as a service.
Following the success of the current project, future work plans are already in place. A new follow-up dCSE SPRINT project is scheduled to begin in the near future. Its objective is to add more parallel functions that perform well on the HECToR system. Moreover, SPRINT functionality is also going to be extended through the ongoing Wellcome Trust grant.
The HECToR system is soon going to be upgraded. The new architecture is quite different from the current system and it will be interesting to benchmark SPRINT and observe how it performs.
[1] dCSE website, “Distributed CSE Support.” Available at :
http://www.hector.ac.uk/cse/distributedcse/, accessed 10 March 2010.
[2] T. Sloan and M. Mewissen, “SPRINTing with HECToR dCSE Proposal.” .
[3] G. Grimes, S. Moodie, J. Beattie, M. Craigon, P. Dickinson, T. Forster, A. Livingston, M. Mewissen, K. Robertson, A. Ross, G. Sing, and P. Ghazal, “GPXMacrophage Expression Atlas: A database for expression profiles of macrophages challenged with a variety of pro-inflammatory, anti-inflammatory, benign and pathogen insults,” BMC Genomics, vol. 6, p. 178, 2005.
[4] A. Brazma, H. Parkinson, U. Sarkans, M. Shojatalab, J. Vilo, N. Abeygunawardena, E. Holloway, M. Kapushesky, P. Kemmeren, G. G. Lara, A. Oezcimen, P. Rocca-Serra, and S.-A. Sansone, “ArrayExpress– a public repository for microarray gene expression data at the EBI,” Nucl. Acids Res., vol. 31, pp. 68–71, 2003.
[5] The R package, “The R Project for Statistical Computing.” Available at :
http://www.r-project.org/, accessed 10 March 2010.
[6] BBSRC web site, “Biotechnology and Biological Sciences Research Council.” Available at : http://www.bbsrc.ac.uk/.
[7] EPCC website, “Edinburgh Parallel Computing Centre.” Available at :
http://www.epcc.ed.ac.uk/, accessed 10 March 2010.
[8] DPM website, “Division of Pathway Medicine.” Available at :
http://www.ed.ac.uk/schools-departments/pathway-medicine, accessed 10 March
2010.
[9] SPRINT’s website, “SPRINT: A new parallel framework for R.” Available at :
http://www.r-sprint.org/, accessed 10 March 2010.
[10] Jon Hill, Matthew Hambley, Thorsten Forster, Muriel Mewissen, Terence M Sloan, Florian Scharinger, Arthur Trew and Peter Ghazal, “SPRINT: A new parallel framework for R,” BMC Bioinformatics, December 2008.
[11] The MPI parallel library, “The Message Passing Interface (MPI) standard.” Available at : http://www.mcs.anl.gov/research/projects/mpi/, accessed 10 March 2010.
[12] HECToR’s user support, “HECToR : Hardware overview.” Available at :
http://www.hector.ac.uk/service/hardware/, accessed 10 March 2010.
[13] J. Hill, “Parallel statistics with R,” EPCC News, vol. 62, p. 7, 2008.
[14] M. Dublin, “New software tool lets researchers user R across a computer cluster.” Available at : http://www.genomeweb.com/new-software-tool-lets-researchers-use-r-across-compute-cluster, accessed 29 March 2010, 2009.
[15] Savvas Petrou, “D1.1 Work Package 1 deliverable. Performance analysis of parallel correlation function pcor.”
[16] Savvas Petrou, “D2.1 Work Package 2 deliverable. Performance analysis of parallel permutation testing function pmaxT.”
[17] NWS, “NetWorkSpaces for R.” Available at : http://nws-r.sourceforge.net/,
accessed 3 March 2010.
[18] Rmpi, “Rmpi for R.” Available at : http://www.stats.uwo.ca/faculty/yu/Rmpi/,
accessed 3 March 2010.
[19] R/parallel, “R/parallel framework.” Available at : http://www.rparallel.org/,
accessed 3 March 2010.
[20] papply, “papply - R parallel apply function.” Available at :
http://math.acadiau.ca/ACMMaC/software/papply.html, accessed 3 March 2010.
[21] SNOW, “Simple Network of Workstations for R.” Available at :
http://www.stat.uiowa.edu/~luke/R/cluster/cluster.html, accessed 3 March 2010.
[22] Wellcome Trust web site, “The Wellcome Trust.” Available at :
http://www.wellcome.ac.uk/.
[23] ECDF, “The Edinburgh Compute and Data Facility.” Available at :
http://www.ecdf.ed.ac.uk/, accessed 10 March 2010.
[24] The FF R package, “ff: memory-efficient storage of large data on disk and fast
access functions.” Available at :
http://cran.r-project.org/web/packages/ff/index.html, accessed 10 March 2010.
[25] Y. Ge, S. Dudoit and T. P. Speed, “Resampling-based multiple testing for microarray data hypothesis,” TEST, vol. 12, pp. 1–77, June 2003.
[26] The multtest
R package, “multtest: Resampling-based multiple hypothesis testing.” Available at :
http://cran.r-project.org/web/packages/multtest/index.html,
accessed 10 March 2010.
[27] Westfall,P.H. and Young, S.S., “Resampling-Based Multiple Testing: Examples and Methods for P-Value Adjustment.,” p. 340, 1993. Wiley, New York.
[28] R User Meeting, “SPRINT Project.” Available at :
http://www.nesc.ac.uk/action/esi/contribution.cfm?Title=1044, accessed 30 March
2010.
[29] Data-Intensive Research Workshop, “SPRINT Project.” Available at :
http://www.nesc.ac.uk/esi/events/1047/, accessed 30 March 2010.
[30] HPDC 2010 Workshop, “Emerging Computational Methods for the Life Sciences
(ECML).” Available at : http://salsahpc.indiana.edu/ECMLS2010/
Accessed 25 April 2010.
[31] ACM International Symposium, “High Performance Distributed Computing
(HPDC).” Available at : http://hpdc2010.eecs.northwestern.edu/
Accessed 25 April 2010.
[32] useR! 2010, “The R User Conference 2010.” Available at : http://user2010.org/
Accessed 25 April 2010.
[33] CRAN, “The Comprehensive R Archive Network.” Available at :
http://cran.r-project.org/, accessed 30 March 2010.