 |
| SAFE for HECToR |
| Service Administration from EPCC |
|
 |
Logged in as Irina
Nazarova.
You are NOT HelpdeskManager
You are NOT HelpdeskOperator
You are RootManager
From 01/01/08 08:00 to 01/02/08 08:00
Report for Resource Pool default ( Default resource pool) on all machines
A total of 40,658,112AUs were available during this period.
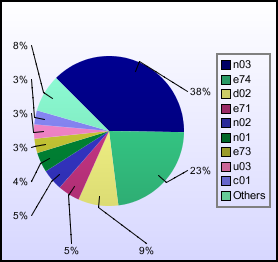
CPU Hours (by project)
| Project | AUs | NJobs | %age of Use | Utilisation |
|---|
| y02 | 134 | 16 | 0% | 0% |
| y05 | 12,641 | 899 | 0.1% | 0% |
| z01 | 12,653 | 182 | 0.1% | 0% |
| z02 | 7 | 20 | 0% | 0% |
| z03 | 2,283 | 406 | 0% | 0% |
| Internal Total | 27,718 | 1523.0 | 0.2% | 0.1% |
| c01 | 396,998 | 480 | 3% | 1% |
| e42 | 110,655 | 127 | 0.8% | 0.3% |
| e63 | 52,831 | 22 | 0.4% | 0.1% |
| e68 | 132,573 | 271 | 1% | 0.3% |
| e69 | 114 | 81 | 0% | 0% |
| e71 | 624,863 | 518 | 4.8% | 1.5% |
| e72 | 5,127 | 98 | 0% | 0% |
| e73 | 406,756 | 12 | 3.1% | 1% |
| e74 | 2,995,292 | 415 | 22.8% | 7.4% |
| e75 | 11,215 | 47 | 0.1% | 0% |
| e77 | 117 | 12 | 0% | 0% |
| u02 | 73,331 | 49 | 0.6% | 0.2% |
| u03 | 402,292 | 19 | 3.1% | 1% |
| u10 | 134,916 | 206 | 1% | 0.3% |
| EPSRC Total | 5,347,081 | 2357.0 | 40.7% | 13.2% |
| n01 | 563,843 | 470 | 4.3% | 1.4% |
| n02 | 599,546 | 610 | 4.6% | 1.5% |
| n03 | 4,962,649 | 1305 | 37.7% | 12.2% |
| u07 | 2,017 | 23 | 0% | 0% |
| NERC Total | 6,128,054 | 2408.0 | 46.6% | 15.1% |
| u04 | 293,690 | 91 | 2.2% | 0.7% |
| BBSRC Total | 293,690 | 91.0 | 2.2% | 0.7% |
| d01 | 216,147 | 4 | 1.6% | 0.5% |
| d02 | 1,138,659 | 39 | 8.7% | 2.8% |
| DirectorsTime Total | 1,354,806 | 43.0 | 10.3% | 3.3% |
| Total | 13,151,349 | 6422.0 | 100% | 32.3% |
Use by Project
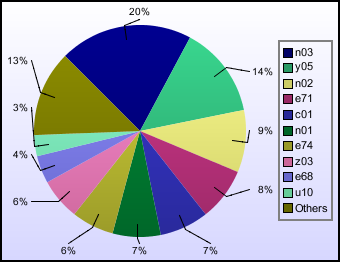
Jobs by Project
AUs (by Queue)
| Queue | AUs | NJobs |
|---|
| par:n1024c1_1h | 5,032 | 5 |
| par:n1024c1_20m | 280 | 1 |
| par:n1024c1_3h | 8,243 | 2 |
| par:n1024c2_12h | 184,389 | 2 |
| par:n1024c2_20m | 5,858 | 8 |
| par:n1024c2_3h | 42,297 | 5 |
| par:n1024c2_6h | 217,450 | 5 |
| par:n128c1_12h | 434,706 | 89 |
| par:n128c1_1h | 2,639 | 32 |
| par:n128c1_20m | 2,791 | 17 |
| par:n128c1_3h | 1,212 | 3 |
| par:n128c2_12h | 1,969,545 | 487 |
| par:n128c2_1h | 6,889 | 20 |
| par:n128c2_20m | 416 | 20 |
| par:n128c2_3h | 48,440 | 16 |
| par:n128c2_6h | 254,366 | 80 |
| par:n16c1_12h | 45,333 | 65 |
| par:n16c1_1h | 425 | 26 |
| par:n16c1_20m | 1,281 | 157 |
| par:n16c1_3h | 36 | 1 |
| par:n16c1_6h | 177 | 5 |
| par:n16c2_12h | 175,649 | 338 |
| par:n16c2_1h | 3,818 | 154 |
| par:n16c2_20m | 250 | 100 |
| par:n16c2_3h | 13,876 | 110 |
| par:n16c2_6h | 45,586 | 179 |
| par:n2048c1_1h | 4,541 | 2 |
| par:n2048c1_3h | 21,059 | 2 |
| par:n2048c2_12h | 1,371,905 | 18 |
| par:n2048c2_1h | 30,996 | 9 |
| par:n2048c2_20m | 7,687 | 14 |
| par:n2048c2_3h | 23,231 | 1 |
| par:n256c1_12h | 402,069 | 30 |
| par:n256c1_1h | 883 | 3 |
| par:n256c1_20m | 6,190 | 14 |
| par:n256c1_3h | 2,996 | 3 |
| par:n256c2_12h | 3,412,518 | 257 |
| par:n256c2_1h | 4,067 | 6 |
| par:n256c2_20m | 3,353 | 25 |
| par:n256c2_3h | 4,631 | 7 |
| par:n256c2_6h | 223,651 | 53 |
| par:n32c1_12h | 61,004 | 55 |
| par:n32c1_1h | 1,124 | 58 |
| par:n32c1_20m | 1,046 | 109 |
| par:n32c1_3h | 648 | 3 |
| par:n32c2_12h | 326,523 | 306 |
| par:n32c2_1h | 2,994 | 73 |
| par:n32c2_20m | 665 | 46 |
| par:n32c2_3h | 6,798 | 51 |
| par:n32c2_6h | 42,298 | 149 |
| par:n4096c1_1h | 1,601 | 3 |
| par:n4096c2_20m | 4,135 | 6 |
| par:n512c1_12h | 3,423 | 6 |
| par:n512c1_1h | 1,503 | 3 |
| par:n512c1_20m | 13,481 | 13 |
| par:n512c1_3h | 3,515 | 2 |
| par:n512c2_12h | 1,902,775 | 130 |
| par:n512c2_1h | 8,393 | 9 |
| par:n512c2_20m | 2,741 | 18 |
| par:n512c2_3h | 55,045 | 14 |
| par:n512c2_6h | 1,064 | 4 |
| par:n64c1_12h | 156,500 | 48 |
| par:n64c1_1h | 246 | 6 |
| par:n64c1_20m | 915 | 45 |
| par:n64c1_3h | 273 | 6 |
| par:n64c1_6h | 37 | 9 |
| par:n64c2_12h | 1,459,000 | 383 |
| par:n64c2_1h | 3,187 | 37 |
| par:n64c2_20m | 1,215 | 85 |
| par:n64c2_3h | 5,474 | 19 |
| par:n64c2_6h | 27,981 | 31 |
| par:n8c1_12h | 1,030 | 13 |
| par:n8c1_1h | 613 | 221 |
| par:n8c1_20m | 414 | 320 |
| par:n8c1_3h | 140 | 18 |
| par:n8c1_6h | 943 | 153 |
| par:n8c2_12h | 54,146 | 338 |
| par:n8c2_1h | 844 | 270 |
| par:n8c2_20m | 389 | 489 |
| par:n8c2_3h | 212 | 21 |
| par:n8c2_6h | 6,255 | 481 |
Slowdown [(runtime+wait)/runtime] (by runtime, in hours)
This section only includes job that ran for more than 300 seconds.
| Time | Slowdown | NJobs |
|---|
| 0-1 hrs | 1.963 | 1184 |
| 1-2 hrs | 1.5 | 304 |
| 2-3 hrs | 1.079 | 163 |
| 3-4 hrs | 1.232 | 114 |
| 4-5 hrs | 1.158 | 177 |
| 5-6 hrs | 1.076 | 103 |
| 6-7 hrs | 1.059 | 83 |
| 7-8 hrs | 1.037 | 45 |
| 8-9 hrs | 1.021 | 58 |
| 9-10 hrs | 1.09 | 97 |
| 10-11 hrs | 1.037 | 138 |
| 11-12 hrs | 1.197 | 217 |
| 12-13 hrs | 1.037 | 169 |
| 13-14 hrs | 1.003 | 1 |
| 15-16 hrs | 1 | 1 |
| 16-17 hrs | 1 | 3 |
| 17-18 hrs | 1 | 1 |
| 18-19 hrs | 1 | 1 |
| 20-21 hrs | 4.472 | 2 |
| 22-23 hrs | 1 | 1 |
| 23-24 hrs | 1 | 1 |
| 24-25 hrs | 1.046 | 1 |
Slowdown [(runtime+wait)/runtime] (by job size)
This section only includes job that ran for more than 300 seconds.
| CPUs | Slowdown | NJobs |
|---|
| 2 | 2.653 | 100 |
| 4 | 1.082 | 78 |
| 6 | 1.12 | 5 |
| 8 | 1.043 | 52 |
| 10 | 1.144 | 7 |
| 12 | 1.013 | 2 |
| 14 | 1.036 | 1 |
| 16 | 1.332 | 186 |
| 18 | 1.016 | 4 |
| 20 | 1.041 | 6 |
| 22 | 1.211 | 25 |
| 24 | 1.037 | 2 |
| 32 | 1.257 | 594 |
| 36 | 1.028 | 1 |
| 38 | 1.057 | 3 |
| 42 | 1.245 | 26 |
| 50 | 1.011 | 1 |
| 64 | 1.415 | 443 |
| 68 | 204.624 | 1 |
| 96 | 1.001 | 3 |
| 100 | 1.031 | 2 |
| 128 | 1.199 | 411 |
| 222 | 1.017 | 59 |
| 232 | 1.01 | 6 |
| 256 | 2.215 | 384 |
| 320 | 1.007 | 12 |
| 376 | 1.008 | 6 |
| 396 | 1.003 | 3 |
| 416 | 1.009 | 6 |
| 512 | 1.071 | 267 |
| 520 | 1.009 | 6 |
| 768 | 1.081 | 28 |
| 826 | 1.001 | 4 |
| 956 | 1.007 | 2 |
| 1024 | 1.882 | 93 |
| 1036 | 1.003 | 3 |
| 2048 | 1.018 | 14 |
| 4096 | 1.056 | 18 |
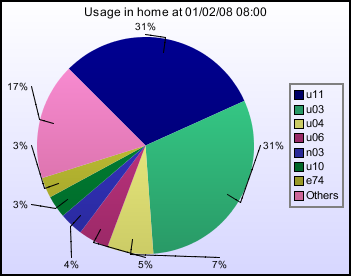
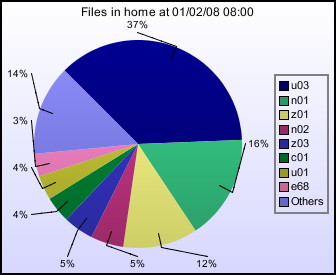
Disc Usage for home, as of 01/02/08 08:00
| Project | Usage(Gb) | Quota(Gb) | Files(Files) |
|---|
| c01 | 26 | 200 | 116,156 |
| d01 | 1 | 100 | 128 |
| d02 | 1 | 100 | 40 |
| d03 | | 100 | |
| d04 | 1 | 100 | 152 |
| e01 | | 100 | |
| e10 | | 200 | 2 |
| e42 | 3 | 100 | 10,578 |
| e63 | 10 | 100 | 14,118 |
| e68 | 6 | 100 | 99,380 |
| e69 | 1 | 100 | 1,844 |
| e70 | 1 | 100 | 4,364 |
| e71 | 29 | 100 | 12,818 |
| e72 | 2 | 100 | 1,526 |
| e73 | 1 | 101 | 324 |
| e74 | 41 | 300 | 46,710 |
| e75 | 1 | 100 | 64 |
| e76 | | 100 | 2 |
| e77 | 18 | 100 | 25,086 |
| e78 | 1 | 100 | 42 |
| n01 | 14 | 100 | 463,166 |
| n02 | 29 | 200 | 145,392 |
| n03 | 47 | 200 | 29,334 |
| n04 | 2 | 200 | 15,842 |
| u01 | 36 | 201 | 108,054 |
| u02 | 2 | 99 | 6,838 |
| u03 | 404 | 500 | 1,047,452 |
| u04 | 91 | 200 | 3,808 |
| u05 | 2 | 200 | 69,902 |
| u06 | 60 | 100 | 2,032 |
| u07 | 2 | 100 | 54,150 |
| u08 | 3 | 200 | 51,800 |
| u09 | 1 | 200 | 160 |
| u10 | 44 | 100 | 29,810 |
| u11 | 406 | 500 | 16,434 |
| x01 | | 100 | |
| y06 | 1 | 100 | 260 |
| y08 | 1 | 100 | 72 |
| z01 | 24 | 100 | 329,751 |
| z02 | 1 | 10 | 38 |
| z03 | 31 | 99 | 133,508 |
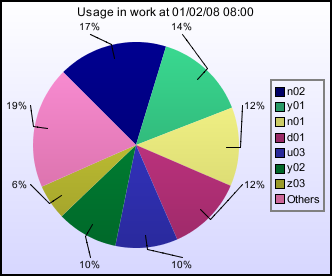
Disc Usage for work, as of 01/02/08 08:00
| Project | Usage(Gb) | Quota(Gb) | Files(Files) |
|---|
| c01 | 101 | 800 | 8,195 |
| d01 | 1,533 | 3,000 | 474 |
| d02 | | 100 | |
| d03 | 1 | 500 | 1 |
| d04 | 1 | 100 | 6 |
| e01 | | 200 | |
| e10 | 1 | 500 | 1 |
| e42 | 331 | 400 | 182,861 |
| e63 | 70 | 100 | 97 |
| e68 | 6 | 100 | 9,267 |
| e69 | 1 | 150 | 33 |
| e70 | 1 | 100 | 3 |
| e71 | 84 | 1,400 | 3,333 |
| e72 | 2 | 1,393 | 1,458 |
| e73 | 333 | 2,800 | 10,248 |
| e74 | 83 | 300 | 4,560 |
| e75 | 10 | 100 | |
| e76 | 1 | 500 | 1 |
| e77 | 1 | 100 | 617 |
| e78 | | 100 | |
| n01 | 1,585 | 3,000 | 6,397 |
| n02 | 2,203 | 5,000 | 279,890 |
| n03 | 88 | 100 | 11,534 |
| n04 | 1 | 1,024 | 8 |
| u01 | 104 | 400 | 14,017 |
| u02 | 10 | 200 | 1,683 |
| u03 | 1,252 | 2,048 | 998,255 |
| u04 | 67 | 399 | 1,639 |
| u05 | 85 | 900 | 5,706 |
| u06 | 117 | 199 | 1,637 |
| u07 | 2 | 103 | 54,150 |
| u08 | 28 | 400 | 54,891 |
| u09 | 287 | 400 | 9,392 |
| u10 | 274 | 400 | 84,536 |
| u11 | 148 | 200 | 4,385 |
| x01 | | 100 | |
| y01 | 1,841 | | 760,653 |
| y02 | 1,231 | | 358,125 |
| y05 | 62 | | 32,075 |
| y06 | 1 | 100 | 4 |
| y07 | 1 | | 2 |
| y08 | 1 | 100 | 3 |
| y09 | 1 | | 3,621 |
| z01 | 154 | 800 | 114,270 |
| z02 | 11 | 29 | 85 |
| z03 | 709 | 2,048 | 27,495 |

From 01/01/08 08:00 to 01/02/08 08:00
A total of 210 queries with a specified service metric were completed in this period.
There were 2 queries without a metric completed in the same period.
Helpdesk targets
| Metric | Pass | Total | Fraction | Target |
|---|
| All queries finished in 1 day | 160 | 161 | 99% | 97% |
| Admin queries finished in 1 day | 141 | 141 | 100% | 97% |
| Queries assigned in 30 min | 206 | 210 | 98% | 97% |
| Technical assessments in 10 days | 6 | 6 | 100% | 97% |
Holiday Dates in this period
| Start Date | Resume Date | Description |
|---|
| 01-Jan-2008 | 02-Jan-2008 | New Years Day |
Queries by project (where known)
| Project | Queries | Percentage |
|---|
| n02 | 100 | 55.9% |
| n03 | 13 | 7.3% |
| c01 | 11 | 6.1% |
| z03 | 9 | 5% |
| y07 | 4 | 2.2% |
| n04 | 4 | 2.2% |
| e77 | 4 | 2.2% |
| e72 | 4 | 2.2% |
| e76 | 3 | 1.7% |
| e74 | 3 | 1.7% |
| e68 | 3 | 1.7% |
| y08 | 2 | 1.1% |
| y06 | 2 | 1.1% |
| y01 | 2 | 1.1% |
| u10 | 2 | 1.1% |
| n01 | 2 | 1.1% |
| e73 | 2 | 1.1% |
| e71 | 2 | 1.1% |
| e42 | 2 | 1.1% |
| z01 | 1 | 0.6% |
| e75 | 1 | 0.6% |
| e69 | 1 | 0.6% |
| e63 | 1 | 0.6% |
| d01 | 1 | 0.6% |
Queries by Service Metric
| Service Metric | Queries | Percentage |
|---|
| Automatic | 107 | 51% |
| In-depth | 43 | 20.5% |
| Admin | 34 | 16.2% |
| Technical | 20 | 9.5% |
| Technical assessment | 6 | 2.9% |
Queries by Category
| Query Category | Queries | Percentage |
|---|
| Set user quotas | 84 | 40% |
| Batch system and queues | 23 | 11% |
| Disk, tapes, resources | 17 | 8.1% |
| Compilers and system software | 13 | 6.2% |
| 3rd Party Software | 12 | 5.7% |
| New User | 11 | 5.2% |
| Access to HECToR | 9 | 4.3% |
| Other | 8 | 3.8% |
| Set group quotas | 6 | 2.9% |
| User programs | 4 | 1.9% |
| SAFE | 4 | 1.9% |
| None | 4 | 1.9% |
| New Password | 4 | 1.9% |
| Porting | 3 | 1.4% |
| Performance and scaling | 2 | 1% |
| New Group | 2 | 1% |
| User behaviour | 1 | 0.5% |
| Static website | 1 | 0.5% |
| Network | 1 | 0.5% |
| Grid | 1 | 0.5% |
Queries by Handler category
| Handlers | Total | Automatic | In-depth | Admin | Technical | Technical assessment | Percentage |
|---|
| OSG | 135 | 107 | 14 | 6 | 8 | | 64.3% |
| CSE | 17 | | 11 | | 1 | 5 | 8.1% |
| Cray Systems | 12 | | 10 | 1 | 1 | | 5.7% |
| USL | 41 | | 8 | 22 | 10 | 1 | 19.5% |
| Other | 5 | | | 5 | | | 2.4% |
Current Tokens
| Date |
Value |
Comment |
| Jan 18, 2008 10:50:09 AM |
* * * * * |
System very reliable and available |