 |
| SAFE for HECToR |
| Service Administration from EPCC |
|
 |
Logged in as Irina
Nazarova.
You are NOT HelpdeskManager
You are NOT HelpdeskOperator
You are RootManager
From 01/02/08 08:00 to 01/03/08 08:00
Report for Resource Pool default ( Default resource pool) on all machines
A total of 38,035,008AUs were available during this period.
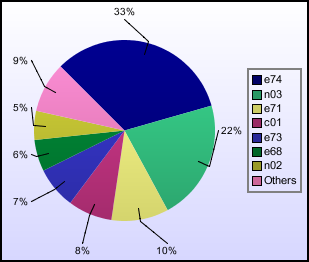
CPU Hours (by project)
| Project | AUs | NJobs | %age of Use | Utilisation |
|---|
| y02 | 157,378 | 593 | 0.8% | 0.4% |
| y03 | 2,729 | 157 | 0% | 0% |
| y04 | 1,554 | 22 | 0% | 0% |
| y05 | 0 | 3 | 0% | 0% |
| z01 | 1,552 | 438 | 0% | 0% |
| z02 | 3,841 | 77 | 0% | 0% |
| z03 | 15,429 | 517 | 0.1% | 0% |
| Internal Total | 182,484 | 1807.0 | 0.9% | 0.5% |
| c01 | 1,587,953 | 1215 | 7.9% | 4.2% |
| e42 | 4,814 | 54 | 0% | 0% |
| e63 | 32,430 | 11 | 0.2% | 0.1% |
| e68 | 1,137,551 | 1010 | 5.7% | 3% |
| e69 | 0 | 1 | 0% | 0% |
| e71 | 2,062,330 | 519 | 10.2% | 5.4% |
| e72 | 831 | 69 | 0% | 0% |
| e73 | 1,498,233 | 53 | 7.4% | 3.9% |
| e74 | 6,654,460 | 696 | 33.1% | 17.5% |
| e75 | 157,617 | 21 | 0.8% | 0.4% |
| e77 | 11,340 | 74 | 0.1% | 0% |
| e78 | 18,903 | 27 | 0.1% | 0% |
| e80 | 275,053 | 5 | 1.4% | 0.7% |
| u03 | 77 | 2 | 0% | 0% |
| u10 | 13,628 | 262 | 0.1% | 0% |
| EPSRC Total | 13,455,222 | 4019.0 | 66.9% | 35.4% |
| n01 | 393,995 | 233 | 2% | 1% |
| n02 | 1,038,471 | 846 | 5.2% | 2.7% |
| n03 | 4,334,862 | 1851 | 21.5% | 11.4% |
| n04 | 7,982 | 50 | 0% | 0% |
| NERC Total | 5,775,311 | 2980.0 | 28.7% | 15.2% |
| u04 | 315,303 | 93 | 1.6% | 0.8% |
| BBSRC Total | 315,303 | 93.0 | 1.6% | 0.8% |
| x01 | 18,046 | 301 | 0.1% | 0% |
| External Total | 18,046 | 301.0 | 0.1% | 0% |
| d01 | 380,135 | 21 | 1.9% | 1% |
| d04 | 1 | 5 | 0% | 0% |
| DirectorsTime Total | 380,136 | 26.0 | 1.9% | 1% |
| Total | 20,126,502 | 9226.0 | 100% | 52.9% |
Use by Project
Jobs by Project
AUs (by Queue)
| Queue | AUs | NJobs |
|---|
| par:n1024c1_12h | 395,812 | 14 |
| par:n1024c1_1h | 30,412 | 29 |
| par:n1024c1_20m | 17,072 | 41 |
| par:n1024c2_12h | 52,812 | 4 |
| par:n1024c2_1h | 10,181 | 11 |
| par:n1024c2_20m | 1,775 | 11 |
| par:n1024c2_3h | 312,294 | 18 |
| par:n1024c2_6h | 42,461 | 4 |
| par:n128c1_12h | 408,857 | 71 |
| par:n128c1_1h | 3,611 | 14 |
| par:n128c1_20m | 1,592 | 27 |
| par:n128c1_3h | 60 | 1 |
| par:n128c2_12h | 2,791,395 | 518 |
| par:n128c2_1h | 3,980 | 53 |
| par:n128c2_20m | 5,406 | 72 |
| par:n128c2_3h | 7,064 | 16 |
| par:n128c2_6h | 70,574 | 22 |
| par:n16c1_12h | 66,362 | 141 |
| par:n16c1_1h | 359 | 10 |
| par:n16c1_20m | 192 | 42 |
| par:n16c1_3h | 6 | 1 |
| par:n16c1_6h | 173 | 1 |
| par:n16c2_12h | 274,834 | 492 |
| par:n16c2_1h | 10,084 | 346 |
| par:n16c2_20m | 428 | 138 |
| par:n16c2_3h | 6,719 | 90 |
| par:n16c2_6h | 133,273 | 393 |
| par:n2048c1_1h | 7,000 | 6 |
| par:n2048c1_20m | 4,980 | 6 |
| par:n2048c2_12h | 1,776,280 | 13 |
| par:n2048c2_1h | 24,581 | 8 |
| par:n2048c2_20m | 16,584 | 16 |
| par:n2048c2_3h | 49,839 | 9 |
| par:n2048c2_6h | 16,365 | 1 |
| par:n256c1_12h | 414,088 | 43 |
| par:n256c1_1h | 7,254 | 41 |
| par:n256c1_20m | 5,106 | 37 |
| par:n256c1_3h | 80 | 1 |
| par:n256c2_12h | 8,050,306 | 612 |
| par:n256c2_1h | 7,026 | 36 |
| par:n256c2_20m | 5,666 | 35 |
| par:n256c2_3h | 51,757 | 28 |
| par:n256c2_6h | 68,128 | 45 |
| par:n32c1_12h | 26,445 | 36 |
| par:n32c1_1h | 1,215 | 45 |
| par:n32c1_20m | 336 | 45 |
| par:n32c1_3h | 216 | 4 |
| par:n32c1_6h | 1,097 | 1 |
| par:n32c2_12h | 599,195 | 515 |
| par:n32c2_1h | 6,623 | 201 |
| par:n32c2_20m | 3,012 | 133 |
| par:n32c2_3h | 3,333 | 62 |
| par:n32c2_6h | 88,804 | 158 |
| par:n4096c1_1h | 362 | 2 |
| par:n4096c1_20m | 899 | 2 |
| par:n4096c2_1h | 1,996 | 6 |
| par:n4096c2_20m | 21,961 | 24 |
| par:n4096c2_3h | 99,931 | 2 |
| par:n512c1_12h | 175,441 | 43 |
| par:n512c1_1h | 4,989 | 21 |
| par:n512c1_20m | 13,130 | 34 |
| par:n512c2_12h | 1,702,470 | 89 |
| par:n512c2_1h | 21,169 | 161 |
| par:n512c2_20m | 3,731 | 31 |
| par:n512c2_3h | 7,739 | 15 |
| par:n512c2_6h | 18,363 | 6 |
| par:n64c1_12h | 144,446 | 48 |
| par:n64c1_1h | 20,344 | 182 |
| par:n64c1_20m | 1,016 | 32 |
| par:n64c1_3h | 96 | 2 |
| par:n64c2_12h | 1,845,418 | 516 |
| par:n64c2_1h | 3,655 | 57 |
| par:n64c2_20m | 3,305 | 129 |
| par:n64c2_3h | 10,674 | 120 |
| par:n64c2_6h | 33,283 | 38 |
| par:n8c1_12h | 1,761 | 13 |
| par:n8c1_1h | 57 | 138 |
| par:n8c1_20m | 196 | 609 |
| par:n8c1_3h | 77 | 31 |
| par:n8c1_6h | 3,029 | 33 |
| par:n8c2_12h | 93,388 | 599 |
| par:n8c2_1h | 2,203 | 366 |
| par:n8c2_20m | 363 | 765 |
| par:n8c2_3h | 2,371 | 208 |
| par:n8c2_6h | 5,533 | 187 |
Slowdown [(runtime+wait)/runtime] (by runtime, in hours)
This section only includes job that ran for more than 300 seconds.
| Time | Slowdown | NJobs |
|---|
| 0-1 hrs | 2.433 | 1923 |
| 1-2 hrs | 1.585 | 429 |
| 2-3 hrs | 1.438 | 281 |
| 3-4 hrs | 1.099 | 232 |
| 4-5 hrs | 1.149 | 136 |
| 5-6 hrs | 1.345 | 142 |
| 6-7 hrs | 1.168 | 160 |
| 7-8 hrs | 1.894 | 121 |
| 8-9 hrs | 1.287 | 114 |
| 9-10 hrs | 1.106 | 108 |
| 10-11 hrs | 1.085 | 183 |
| 11-12 hrs | 1.346 | 300 |
| 12-13 hrs | 1.081 | 346 |
Slowdown [(runtime+wait)/runtime] (by job size)
This section only includes job that ran for more than 300 seconds.
| CPUs | Slowdown | NJobs |
|---|
| 2 | 1.134 | 145 |
| 4 | 4.854 | 86 |
| 6 | 1.036 | 4 |
| 8 | 1.131 | 176 |
| 10 | 1.006 | 15 |
| 12 | 1.006 | 1 |
| 16 | 1.979 | 397 |
| 18 | 1.002 | 3 |
| 20 | 1.003 | 3 |
| 22 | 1.03 | 3 |
| 24 | 1.016 | 5 |
| 32 | 1.484 | 1103 |
| 34 | 2.353 | 2 |
| 42 | 1.025 | 10 |
| 48 | 1.023 | 6 |
| 50 | 1.219 | 2 |
| 52 | 1.016 | 1 |
| 56 | 1.004 | 6 |
| 62 | 1.019 | 1 |
| 64 | 1.465 | 631 |
| 74 | 1.005 | 2 |
| 80 | 1.936 | 11 |
| 82 | 3.736 | 8 |
| 94 | 1.054 | 1 |
| 96 | 1.098 | 7 |
| 100 | 1.002 | 4 |
| 102 | 1.012 | 4 |
| 104 | 1.008 | 4 |
| 106 | 1.01 | 1 |
| 114 | 1.006 | 1 |
| 118 | 1.054 | 17 |
| 122 | 2.575 | 49 |
| 124 | 1.056 | 1 |
| 128 | 1.746 | 550 |
| 144 | 1.036 | 7 |
| 160 | 1.349 | 3 |
| 192 | 1.253 | 39 |
| 210 | 1.005 | 1 |
| 222 | 1.171 | 38 |
| 242 | 1.009 | 2 |
| 256 | 1.717 | 383 |
| 288 | 1.008 | 5 |
| 320 | 1.044 | 2 |
| 376 | 1.521 | 8 |
| 384 | 1.801 | 2 |
| 416 | 1.233 | 2 |
| 448 | 3.516 | 1 |
| 496 | 1.676 | 1 |
| 512 | 1.968 | 501 |
| 514 | 1.011 | 3 |
| 544 | 1.018 | 6 |
| 576 | 2.348 | 12 |
| 640 | 2.651 | 4 |
| 720 | 1.004 | 1 |
| 768 | 1.007 | 1 |
| 956 | 1.008 | 1 |
| 1024 | 5.414 | 108 |
| 1280 | 1.2 | 10 |
| 1536 | 1.001 | 1 |
| 2048 | 1.237 | 37 |
| 3072 | 1.002 | 1 |
| 4096 | 1.373 | 30 |
| 8128 | 1.015 | 1 |
| 8192 | 32.059 | 4 |
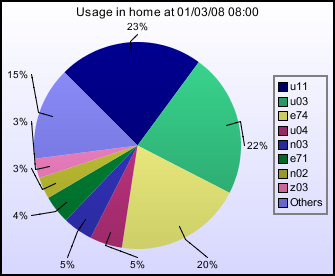
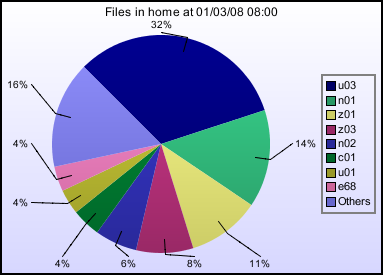
Disc Usage for home, as of 01/03/08 08:00
| Project | Usage(Gb) | Quota(Gb) | Files(Files) |
|---|
| c01 | 31 | 200 | 137,726 |
| d01 | 2 | 100 | 40,588 |
| d02 | 1 | 100 | 40 |
| d03 | 1 | 100 | 112 |
| d04 | 1 | 100 | 8,116 |
| e01 | | 100 | |
| e10 | 1 | 200 | 266 |
| e35 | 2 | 100 | 10,070 |
| e42 | 3 | 100 | 10,644 |
| e63 | 10 | 100 | 14,122 |
| e68 | 13 | 100 | 119,686 |
| e69 | 1 | 100 | 2,544 |
| e70 | 1 | 100 | 4,364 |
| e71 | 79 | 100 | 13,922 |
| e72 | 2 | 50 | 6,124 |
| e73 | 1 | 101 | 620 |
| e74 | 357 | 1,400 | 60,386 |
| e75 | 1 | 100 | 64 |
| e76 | 1 | 100 | 40 |
| e77 | 43 | 100 | 37,214 |
| e78 | 1 | 100 | 6,138 |
| e79 | | 100 | |
| e80 | 1 | 100 | 76 |
| n01 | 14 | 100 | 466,622 |
| n02 | 61 | 200 | 202,444 |
| n03 | 85 | 200 | 31,882 |
| n04 | 13 | 200 | 27,856 |
| u01 | 40 | 201 | 119,768 |
| u02 | 2 | 99 | 6,840 |
| u03 | 404 | 500 | 1,047,452 |
| u04 | 91 | 200 | 3,850 |
| u05 | 2 | 200 | 69,902 |
| u06 | 12 | 100 | 532 |
| u07 | 2 | 100 | 54,150 |
| u08 | 3 | 200 | 51,800 |
| u09 | 1 | 200 | 172 |
| u10 | 45 | 100 | 31,632 |
| u11 | 406 | 500 | 16,456 |
| x01 | 1 | 100 | 140 |
| y06 | 1 | 100 | 276 |
| y08 | 1 | 100 | 72 |
| z01 | 29 | 101 | 347,587 |
| z02 | 1 | 10 | 74 |
| z03 | 55 | 99 | 272,930 |
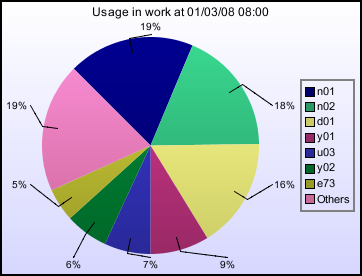
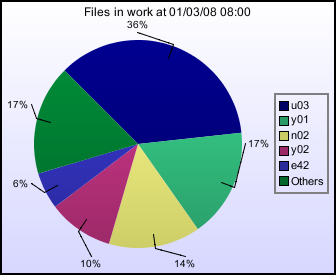
Disc Usage for work, as of 01/03/08 08:00
| Project | Usage(Gb) | Quota(Gb) | Files(Files) |
|---|
| c01 | 405 | 500 | 88,085 |
| d01 | 3,448 | 5,000 | 9,588 |
| d02 | 1 | 100 | 3 |
| d03 | 1 | 500 | 5 |
| d04 | 1 | 100 | 28 |
| e01 | | 200 | |
| e10 | 1 | 500 | 9 |
| e35 | 1 | 403 | 5 |
| e42 | 382 | 400 | 256,607 |
| e63 | 58 | 100 | 393 |
| e68 | 35 | 100 | 23,397 |
| e69 | 1 | 150 | 48 |
| e70 | 1 | 100 | 27 |
| e71 | 205 | 2,800 | 11,125 |
| e72 | 2 | 1,550 | 806 |
| e73 | 1,035 | 3,500 | 38,873 |
| e74 | 478 | 700 | 11,683 |
| e75 | 181 | 2,000 | 4,620 |
| e76 | 1 | 500 | 3 |
| e77 | 76 | 100 | 3,627 |
| e78 | 6 | 100 | 1,482 |
| e79 | 1 | 200 | 1 |
| e80 | 1 | 500 | 4 |
| n01 | 3,945 | 6,210 | 34,301 |
| n02 | 3,871 | 10,200 | 639,102 |
| n03 | 290 | 1,624 | 24,894 |
| n04 | 15 | 1,024 | 3,937 |
| u01 | 108 | 400 | 32,105 |
| u02 | 10 | 200 | 1,733 |
| u03 | 1,447 | 2,048 | 1,602,794 |
| u04 | 385 | 399 | 3,336 |
| u05 | 85 | 900 | 5,706 |
| u06 | 106 | 199 | 1,153 |
| u07 | 187 | 200 | 116,302 |
| u08 | 64 | 400 | 90,218 |
| u09 | 187 | 400 | 6,351 |
| u10 | 295 | 400 | 30,878 |
| u11 | 102 | 200 | 3,753 |
| x01 | 9 | 100 | 1,936 |
| y01 | 1,841 | 3,072 | 760,653 |
| y02 | 1,341 | 2,972 | 455,517 |
| y03 | 9 | 100 | 4,803 |
| y04 | 1 | 100 | 401 |
| y05 | 12 | | 28,936 |
| y06 | 1 | 100 | 4 |
| y07 | 1 | | 2 |
| y08 | 1 | 100 | 3 |
| y09 | 1 | 100 | 3,233 |
| z01 | 131 | 10,720 | 120,243 |
| z02 | 11 | 93 | 188 |
| z03 | 219 | 2,048 | 57,381 |
From 01/02/08 08:00 to 01/03/08 08:00
A total of 275 queries with a specified service metric were completed in this period.
There were 0 queries without a metric completed in the same period.
Helpdesk targets
| Metric | Pass | Total | Fraction | Target |
|---|
| All queries finished in 1 day | 228 | 228 | 100% | 97% |
| Admin queries finished in 1 day | 196 | 196 | 100% | 97% |
| Queries assigned in 30 min | 271 | 275 | 99% | 97% |
| Technical assessments in 10 days | 5 | 6 | 83% | 97% |
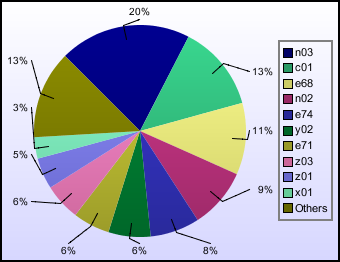
Queries by project (where known)
| Project | Queries | Percentage |
|---|
| n02 | 60 | 25% |
| e72 | 28 | 11.7% |
| e35 | 19 | 7.9% |
| n03 | 18 | 7.5% |
| z01 | 11 | 4.6% |
| e74 | 10 | 4.2% |
| z02 | 8 | 3.3% |
| e10 | 7 | 2.9% |
| y06 | 6 | 2.5% |
| c01 | 6 | 2.5% |
| n01 | 5 | 2.1% |
| e80 | 5 | 2.1% |
| d04 | 5 | 2.1% |
| y07 | 4 | 1.7% |
| x01 | 4 | 1.7% |
| e73 | 4 | 1.7% |
| d03 | 4 | 1.7% |
| d01 | 4 | 1.7% |
| z03 | 3 | 1.2% |
| y04 | 3 | 1.2% |
| u01 | 3 | 1.2% |
| n04 | 3 | 1.2% |
| e79 | 3 | 1.2% |
| y08 | 2 | 0.8% |
| y02 | 2 | 0.8% |
| u03 | 2 | 0.8% |
| e71 | 2 | 0.8% |
| e42 | 2 | 0.8% |
| y09 | 1 | 0.4% |
| y03 | 1 | 0.4% |
| y01 | 1 | 0.4% |
| e76 | 1 | 0.4% |
| e75 | 1 | 0.4% |
| e68 | 1 | 0.4% |
| d02 | 1 | 0.4% |
Queries by Service Metric
| Service Metric | Queries | Percentage |
|---|
| Automatic | 155 | 56.4% |
| In-depth | 41 | 14.9% |
| Admin | 41 | 14.9% |
| Technical | 32 | 11.6% |
| Technical assessment | 6 | 2.2% |
Queries by Category
| Query Category | Queries | Percentage |
|---|
| Set group quotas | 59 | 21.5% |
| Set user quotas | 38 | 13.8% |
| New User | 36 | 13.1% |
| Disk, tapes, resources | 21 | 7.6% |
| Compilers and system software | 15 | 5.5% |
| None | 14 | 5.1% |
| Access to HECToR | 14 | 5.1% |
| Batch system and queues | 12 | 4.4% |
| New Group | 11 | 4% |
| Other | 10 | 3.6% |
| Add to group | 10 | 3.6% |
| 3rd Party Software | 10 | 3.6% |
| SAFE | 5 | 1.8% |
| New Password | 5 | 1.8% |
| Join Project | 5 | 1.8% |
| User behaviour | 2 | 0.7% |
| Login, passwords and ssh | 2 | 0.7% |
| User programs | 1 | 0.4% |
| Performance and scaling | 1 | 0.4% |
| Network | 1 | 0.4% |
| Grid | 1 | 0.4% |
| Delete from group | 1 | 0.4% |
| Create certificate | 1 | 0.4% |
Queries by Handler category
| Handlers | Total | In-depth | Admin | Technical assessment | Technical | Automatic | Percentage |
|---|
| Cray Systems | 4 | 3 | | | 1 | | 1.5% |
| USL | 50 | 12 | 26 | | 12 | | 18.2% |
| OSG | 195 | 15 | 9 | | 16 | 155 | 70.9% |
| CSE | 19 | 11 | | 6 | 2 | | 6.9% |
| Other | 7 | | 6 | | 1 | | 2.5% |
Current Tokens
| Date |
Value |
Comment |
| Feb 4, 2008 3:05:04 PM |
* * * * * |
|