
| SAFE for HECToR |
| Service Administration from EPCC |

|
|
|
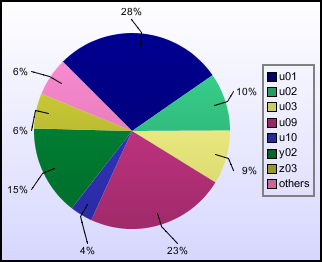
From 01/09/07 08:00 to 01/10/07 08:00
A total of 37,620,000AUs were available during this period.
| Project | AUs | NJobs | %age of Use | Utilisation |
|---|---|---|---|---|
| y02 | 1,677,450 | 374 | 14.9% | 4.5% |
| y03 | 1,004 | 47 | 0% | 0% |
| z01 | 65,157 | 876 | 0.6% | 0.2% |
| z02 | 18,954 | 74 | 0.2% | 0.1% |
| z03 | 654,574 | 188 | 5.8% | 1.7% |
| Internal Total | 2,417,138 | 1559.0 | 21.4% | 6.4% |
| u02 | 1,081,474 | 412 | 9.6% | 2.9% |
| u03 | 997,618 | 47 | 8.8% | 2.7% |
| u06 | 211,918 | 98 | 1.9% | 0.6% |
| u09 | 2,599,815 | 74 | 23% | 6.9% |
| u10 | 418,299 | 272 | 3.7% | 1.1% |
| u11 | 302,771 | 371 | 2.7% | 0.8% |
| EPSRC Total | 5,611,895 | 1274.0 | 49.7% | 14.9% |
| u01 | 3,142,466 | 322 | 27.9% | 8.4% |
| u05 | 28,668 | 47 | 0.3% | 0.1% |
| u07 | 707 | 197 | 0% | 0% |
| NERC Total | 3,171,841 | 566.0 | 28.1% | 8.4% |
| u04 | 7,795 | 57 | 0.1% | 0% |
| BBSRC Total | 7,795 | 57.0 | 0.1% | 0% |
| u08 | 71,994 | 52 | 0.6% | 0.2% |
| STFC Total | 71,994 | 52.0 | 0.6% | 0.2% |
| Total | 11,280,663 | 3508.0 | 100% | 30% |
| Queue | AUs | NJobs |
|---|---|---|
| par128_1 | 347 | 3 |
| par16_1 | 0 | 5 |
| par32_1 | 77 | 17 |
| par4096_1 | 6,018 | 6 |
| par64_1 | 143 | 1 |
| par:n1024c1_12h | 241 | 1 |
| par:n1024c1_1h | 9,077 | 2 |
| par:n1024c1_20m | 2,210 | 12 |
| par:n1024c1_3h | 6,410 | 5 |
| par:n1024c1_6h | 136 | 1 |
| par:n1024c2_12h | 1,092,029 | 36 |
| par:n1024c2_1h | 10,149 | 16 |
| par:n1024c2_20m | 2,197 | 12 |
| par:n1024c2_3h | 43,973 | 8 |
| par:n1024c2_6h | 101,744 | 3 |
| par:n128c1_12h | 28 | 1 |
| par:n128c1_1h | 5,082 | 21 |
| par:n128c1_20m | 233 | 23 |
| par:n128c1_3h | 11,497 | 12 |
| par:n128c1_6h | 5,121 | 3 |
| par:n128c2_12h | 906,723 | 142 |
| par:n128c2_1h | 12,389 | 84 |
| par:n128c2_20m | 3,891 | 89 |
| par:n128c2_3h | 7,268 | 15 |
| par:n128c2_6h | 46,736 | 18 |
| par:n16c1_1h | 130 | 19 |
| par:n16c1_20m | 117 | 37 |
| par:n16c1_6h | 1,396 | 5 |
| par:n16c2_12h | 10,217 | 19 |
| par:n16c2_1h | 1,842 | 138 |
| par:n16c2_20m | 817 | 170 |
| par:n16c2_3h | 1,706 | 64 |
| par:n16c2_6h | 2,747 | 14 |
| par:n2048c1_12h | 399,076 | 5 |
| par:n2048c1_1h | 146 | 1 |
| par:n2048c1_20m | 4,693 | 10 |
| par:n2048c1_3h | 55 | 1 |
| par:n2048c2_12h | 2,804,120 | 30 |
| par:n2048c2_1h | 26,646 | 33 |
| par:n2048c2_20m | 10,837 | 13 |
| par:n2048c2_3h | 24,673 | 3 |
| par:n2048c2_6h | 42,847 | 1 |
| par:n256c1_12h | 39 | 1 |
| par:n256c1_1h | 180 | 2 |
| par:n256c1_20m | 261 | 22 |
| par:n256c2_12h | 878,564 | 84 |
| par:n256c2_1h | 11,025 | 34 |
| par:n256c2_20m | 10,078 | 54 |
| par:n256c2_3h | 18,861 | 12 |
| par:n256c2_6h | 97,769 | 15 |
| par:n32c1_1h | 424 | 78 |
| par:n32c1_20m | 320 | 38 |
| par:n32c1_3h | 402 | 4 |
| par:n32c1_6h | 149 | 1 |
| par:n32c2_12h | 85,247 | 84 |
| par:n32c2_1h | 2,505 | 53 |
| par:n32c2_20m | 1,530 | 140 |
| par:n32c2_3h | 1,085 | 3 |
| par:n32c2_6h | 17,268 | 21 |
| par:n4096c1_1h | 221 | 1 |
| par:n4096c1_20m | 16,924 | 10 |
| par:n4096c1_3h | 131 | 1 |
| par:n4096c2_1h | 11,701 | 8 |
| par:n4096c2_20m | 7,406 | 12 |
| par:n512c1_12h | 199,058 | 18 |
| par:n512c1_1h | 5,002 | 5 |
| par:n512c1_20m | 530 | 15 |
| par:n512c1_3h | 5 | 1 |
| par:n512c2_12h | 1,734,693 | 97 |
| par:n512c2_1h | 26,832 | 17 |
| par:n512c2_20m | 2,039 | 24 |
| par:n512c2_3h | 100,225 | 23 |
| par:n512c2_6h | 112,472 | 10 |
| par:n64c1_12h | 5,667 | 1 |
| par:n64c1_1h | 527 | 7 |
| par:n64c1_20m | 723 | 38 |
| par:n64c2_12h | 551,831 | 223 |
| par:n64c2_1h | 5,319 | 46 |
| par:n64c2_20m | 7,500 | 164 |
| par:n64c2_3h | 8,532 | 35 |
| par:n64c2_6h | 50,940 | 49 |
| par:n8c1_12h | 3 | 7 |
| par:n8c1_1h | 46 | 11 |
| par:n8c1_20m | 171 | 151 |
| par:n8c1_3h | 5 | 1 |
| par:n8c2_12h | 30,456 | 56 |
| par:n8c2_1h | 917 | 252 |
| par:n8c2_20m | 932 | 392 |
| par:n8c2_3h | 257 | 28 |
| par:n8c2_6h | 1,735 | 44 |
| special | 1,666,374 | 16 |
This section only includes job that ran for more than 300 seconds.
| Time | Slowdown | NJobs |
|---|---|---|
| 0-1 hrs | 1.892 | 655 |
| 1-2 hrs | 1.988 | 106 |
| 2-3 hrs | 2.014 | 79 |
| 3-4 hrs | 2.597 | 61 |
| 4-5 hrs | 1.851 | 48 |
| 5-6 hrs | 1.532 | 39 |
| 6-7 hrs | 1.536 | 38 |
| 7-8 hrs | 1.248 | 33 |
| 8-9 hrs | 1.351 | 38 |
| 9-10 hrs | 1.14 | 21 |
| 10-11 hrs | 1.078 | 31 |
| 11-12 hrs | 1.068 | 88 |
| 12-13 hrs | 1.136 | 71 |
| 13-14 hrs | 1 | 1 |
| 17-18 hrs | 1.587 | 1 |
This section only includes job that ran for more than 300 seconds.
| CPUs | Slowdown | NJobs |
|---|---|---|
| 2 | 1.894 | 12 |
| 4 | 1.797 | 18 |
| 6 | 1.003 | 1 |
| 8 | 1.024 | 39 |
| 12 | 1.057 | 3 |
| 16 | 1.155 | 158 |
| 18 | 1.002 | 2 |
| 24 | 1.003 | 1 |
| 28 | 1.01 | 3 |
| 32 | 1.064 | 108 |
| 48 | 1.002 | 2 |
| 56 | 1 | 1 |
| 64 | 1.503 | 147 |
| 66 | 1.002 | 2 |
| 68 | 1.254 | 1 |
| 96 | 1.188 | 8 |
| 98 | 1 | 2 |
| 100 | 1.048 | 1 |
| 114 | 1.011 | 6 |
| 122 | 1.001 | 7 |
| 124 | 1.01 | 15 |
| 128 | 2.739 | 274 |
| 132 | 1.016 | 1 |
| 196 | 1.065 | 2 |
| 198 | 1.022 | 2 |
| 216 | 1.002 | 3 |
| 222 | 3.976 | 16 |
| 228 | 1.014 | 5 |
| 256 | 1.181 | 166 |
| 288 | 1.001 | 1 |
| 396 | 1.008 | 6 |
| 512 | 2.861 | 105 |
| 576 | 1.029 | 1 |
| 768 | 1.088 | 44 |
| 792 | 1.024 | 2 |
| 1024 | 1.405 | 63 |
| 2016 | 1.002 | 2 |
| 2048 | 1.738 | 26 |
| 2560 | 1.446 | 4 |
| 4048 | 6.659 | 3 |
| 4096 | 1.97 | 40 |
| 8192 | 1.268 | 3 |
| 11328 | 1.258 | 4 |
| Project Code | Quota (Gb) |
|---|---|
| u02 | 102 |
| u03 | 102 |
| u04 | 204 |
| u05 | 204 |
| u06 | 102 |
| u07 | 102 |
| u08 | 204 |
| u09 | 204 |
| u10 | 102 |
| u11 | 102 |
| y02 | 102 |
| y08 | 102 |
| z01 | 204 |
| z02 | 102 |
| Project Code | Quota (Gb) |
|---|---|
| u01 | 400 |
| u02 | 200 |
| u03 | 1024 |
| u04 | 400 |
| u05 | 1024 |
| u06 | 200 |
| u07 | 200 |
| u08 | 400 |
| u09 | 400 |
| u10 | 400 |
| u11 | 200 |
| y02 | 100 |
| y08 | 100 |
| z01 | 200 |
| z02 | 100 |
| z03 | 1024 |
A total of 261 queries with a specified service metric were completed in this period. There were 3 queries without a metric completed in the same period.
| Metric | Pass | Total | Fraction | Target |
|---|---|---|---|---|
| All queries finished in 1 day | 217 | 236 | 92% | 97% |
| Admin queries finished in 1 day | 179 | 194 | 92% | 97% |
| Queries assigned in 30 min | 232 | 261 | 89% | 97% |
| Technical assessments in 10 days | 9 | 9 | 100% | 97% |
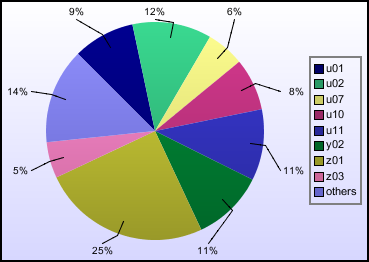
| Project | Queries | Percentage |
|---|---|---|
| z01 | 39 | 14.9% |
| No Project | 30 | 11.5% |
| z02 | 28 | 10.7% |
| z03 | 22 | 8.4% |
| u10 | 20 | 7.7% |
| u02 | 17 | 6.5% |
| y02 | 15 | 5.7% |
| u05 | 13 | 5% |
| u06 | 10 | 3.8% |
| u07 | 9 | 3.4% |
| y08 | 8 | 3.1% |
| u11 | 8 | 3.1% |
| u03 | 8 | 3.1% |
| u08 | 7 | 2.7% |
| u01 | 7 | 2.7% |
| u09 | 6 | 2.3% |
| u04 | 6 | 2.3% |
| y07 | 3 | 1.1% |
| y05 | 2 | 0.8% |
| z04 | 1 | 0.4% |
| y06 | 1 | 0.4% |
| y01 | 1 | 0.4% |
| Service Metric | Queries | Percentage |
|---|---|---|
| Automatic | 166 | 63.6% |
| Technical | 42 | 16.1% |
| Admin | 28 | 10.7% |
| In-depth | 16 | 6.1% |
| Technical assessment | 9 | 3.4% |
| Query Category | Queries | Percentage |
|---|---|---|
| New User | 80 | 30.7% |
| Set group quotas | 37 | 14.2% |
| Access to HECToR | 18 | 6.9% |
| New Group | 17 | 6.5% |
| Compilers and system software | 14 | 5.4% |
| Set user quotas | 12 | 4.6% |
| New Password | 11 | 4.2% |
| Disk, tapes, resources | 11 | 4.2% |
| Other | 9 | 3.4% |
| Login, passwords and ssh | 8 | 3.1% |
| SAFE | 7 | 2.7% |
| Join Project | 7 | 2.7% |
| Batch system and queues | 6 | 2.3% |
| Static website | 4 | 1.5% |
| Performance and scaling | 4 | 1.5% |
| User behaviour | 3 | 1.1% |
| Courses | 3 | 1.1% |
| 3rd Party Software | 3 | 1.1% |
| None | 2 | 0.8% |
| Network | 2 | 0.8% |
| Remove account | 1 | 0.4% |
| Porting | 1 | 0.4% |
| Delete from project | 1 | 0.4% |
| Handlers | Total | Technical assessment | In-depth | Admin | Automatic | Technical | Percentage |
|---|---|---|---|---|---|---|---|
| CSE | 9 | 7 | 2 | 3.4% | |||
| OSG | 196 | 6 | 7 | 166 | 17 | 75.1% | |
| USL | 43 | 2 | 4 | 18 | 19 | 16.5% | |
| Other | 7 | 2 | 3 | 2 | 2.7% | ||
| Cray Systems | 6 | 2 | 4 | 2.3% |
| Date | Value | Comment |
| Sep 2, 2007 9:02:24 AM | * | This is a test |
| HECToR Admin FAQ | Questions about SAFE | SAFE is an EPCC product |