
| SAFE for HECToR |
| Service Administration from EPCC |

|
|
|
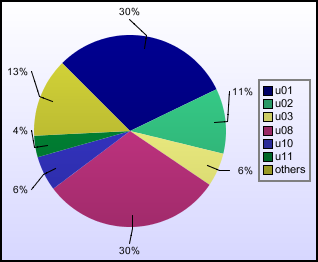
From 01/10/07 08:00 to 01/11/07 08:00
A total of 38,926,250AUs were available during this period.
| Project | AUs | NJobs | %age of Use | Utilisation |
|---|---|---|---|---|
| y01 | 49,735 | 49 | 0.3% | 0.1% |
| y02 | 99,693 | 683 | 0.6% | 0.3% |
| y03 | 1,583 | 168 | 0% | 0% |
| y05 | 117,982 | 239 | 0.7% | 0.3% |
| y07 | 3 | 2 | 0% | 0% |
| z01 | 206,017 | 760 | 1.2% | 0.5% |
| z02 | 53 | 21 | 0% | 0% |
| z03 | 1,633 | 135 | 0% | 0% |
| Internal Total | 476,699 | 2057.0 | 2.8% | 1.2% |
| e42 | 26,313 | 33 | 0.2% | 0.1% |
| u02 | 1,837,179 | 316 | 11% | 4.7% |
| u03 | 946,256 | 62 | 5.7% | 2.4% |
| u06 | 419,516 | 208 | 2.5% | 1.1% |
| u09 | 333,986 | 36 | 2% | 0.9% |
| u10 | 983,134 | 257 | 5.9% | 2.5% |
| u11 | 605,427 | 305 | 3.6% | 1.6% |
| y09 | 30 | 14 | 0% | 0% |
| EPSRC Total | 5,151,841 | 1231.0 | 30.8% | 13.2% |
| n01 | 153,837 | 24 | 0.9% | 0.4% |
| n02 | 49 | 5 | 0% | 0% |
| n03 | 472,850 | 152 | 2.8% | 1.2% |
| u01 | 5,080,873 | 321 | 30.3% | 13.1% |
| u05 | 3,538 | 28 | 0% | 0% |
| u07 | 70,194 | 379 | 0.4% | 0.2% |
| NERC Total | 5,781,341 | 909.0 | 34.5% | 14.9% |
| u04 | 267,613 | 94 | 1.6% | 0.7% |
| BBSRC Total | 267,613 | 94.0 | 1.6% | 0.7% |
| u08 | 5,069,988 | 109 | 30.3% | 13% |
| STFC Total | 5,069,988 | 109.0 | 30.3% | 13% |
| Total | 16,747,482 | 4400.0 | 100% | 43% |
| Queue | AUs | NJobs |
|---|---|---|
| dtspecial | 0 | 1 |
| par:n1024c1_1h | 14,230 | 9 |
| par:n1024c1_20m | 1,597 | 9 |
| par:n1024c1_3h | 8,611 | 6 |
| par:n1024c2_12h | 6,518,494 | 107 |
| par:n1024c2_1h | 35,261 | 38 |
| par:n1024c2_20m | 2,179 | 11 |
| par:n1024c2_3h | 16,689 | 13 |
| par:n1024c2_6h | 86,320 | 6 |
| par:n128c1_12h | 27 | 1 |
| par:n128c1_1h | 2,275 | 17 |
| par:n128c1_20m | 409 | 8 |
| par:n128c1_3h | 3,964 | 5 |
| par:n128c2_12h | 1,852,384 | 234 |
| par:n128c2_1h | 10,172 | 76 |
| par:n128c2_20m | 1,846 | 20 |
| par:n128c2_3h | 15,073 | 174 |
| par:n128c2_6h | 13,578 | 10 |
| par:n16c1_12h | 1,418 | 2 |
| par:n16c1_1h | 49 | 8 |
| par:n16c1_20m | 205 | 19 |
| par:n16c1_3h | 6 | 2 |
| par:n16c2_12h | 115,087 | 115 |
| par:n16c2_1h | 3,860 | 168 |
| par:n16c2_20m | 809 | 115 |
| par:n16c2_3h | 911 | 63 |
| par:n16c2_6h | 10,530 | 14 |
| par:n2048c1_1h | 87,841 | 56 |
| par:n2048c1_20m | 13,712 | 7 |
| par:n2048c1_3h | 49,347 | 29 |
| par:n2048c2_12h | 12,053 | 3 |
| par:n2048c2_1h | 44,994 | 12 |
| par:n2048c2_20m | 12,609 | 19 |
| par:n2048c2_3h | 6,855 | 2 |
| par:n2048c2_6h | 48,482 | 1 |
| par:n256c1_12h | 219,523 | 9 |
| par:n256c1_1h | 3,224 | 12 |
| par:n256c1_20m | 2,988 | 25 |
| par:n256c1_3h | 7,285 | 40 |
| par:n256c2_12h | 1,969,365 | 128 |
| par:n256c2_1h | 25,608 | 98 |
| par:n256c2_20m | 2,716 | 34 |
| par:n256c2_3h | 16,115 | 19 |
| par:n256c2_6h | 45,682 | 12 |
| par:n32c1_12h | 1,214 | 5 |
| par:n32c1_1h | 289 | 16 |
| par:n32c1_20m | 535 | 37 |
| par:n32c1_3h | 187 | 39 |
| par:n32c2_12h | 405,526 | 186 |
| par:n32c2_1h | 2,976 | 101 |
| par:n32c2_20m | 2,507 | 138 |
| par:n32c2_3h | 4,992 | 27 |
| par:n32c2_6h | 1,651 | 11 |
| par:n4096c1_1h | 20,178 | 3 |
| par:n4096c1_20m | 6,013 | 4 |
| par:n4096c1_3h | 840 | 2 |
| par:n4096c2_1h | 50,782 | 4 |
| par:n4096c2_20m | 14,832 | 21 |
| par:n512c1_1h | 5,667 | 15 |
| par:n512c1_20m | 2,484 | 12 |
| par:n512c1_3h | 3,491 | 4 |
| par:n512c2_12h | 3,905,020 | 164 |
| par:n512c2_1h | 25,288 | 24 |
| par:n512c2_20m | 3,081 | 17 |
| par:n512c2_3h | 9,006 | 17 |
| par:n64c1_12h | 49,467 | 22 |
| par:n64c1_1h | 1,090 | 25 |
| par:n64c1_20m | 547 | 22 |
| par:n64c1_3h | 325 | 5 |
| par:n64c2_12h | 674,827 | 199 |
| par:n64c2_1h | 7,303 | 102 |
| par:n64c2_20m | 3,152 | 113 |
| par:n64c2_3h | 25,056 | 247 |
| par:n64c2_6h | 143,131 | 79 |
| par:n8c1_1h | 30 | 22 |
| par:n8c1_20m | 216 | 197 |
| par:n8c1_3h | 31 | 13 |
| par:n8c1_6h | 13 | 2 |
| par:n8c2_12h | 89,172 | 235 |
| par:n8c2_1h | 919 | 116 |
| par:n8c2_20m | 520 | 348 |
| par:n8c2_3h | 39 | 10 |
| par:n8c2_6h | 654 | 15 |
| ser:1h | 48 | 21 |
| serial_1h | 2 | 1 |
| serial_3h | 3 | 2 |
This section only includes job that ran for more than 300 seconds.
| Time | Slowdown | NJobs |
|---|---|---|
| 0-1 hrs | 4.409 | 1025 |
| 1-2 hrs | 2.586 | 102 |
| 2-3 hrs | 1.329 | 58 |
| 3-4 hrs | 1.247 | 41 |
| 4-5 hrs | 2.004 | 35 |
| 5-6 hrs | 2.339 | 45 |
| 6-7 hrs | 1.675 | 73 |
| 7-8 hrs | 1.348 | 39 |
| 8-9 hrs | 1.242 | 102 |
| 9-10 hrs | 1.778 | 81 |
| 10-11 hrs | 1.362 | 127 |
| 11-12 hrs | 1.481 | 232 |
| 12-13 hrs | 1.306 | 204 |
| 16-17 hrs | 1 | 2 |
| 17-18 hrs | 1 | 2 |
This section only includes job that ran for more than 300 seconds.
| CPUs | Slowdown | NJobs |
|---|---|---|
| 2 | 1.06 | 43 |
| 4 | 70.812 | 21 |
| 6 | 2.039 | 4 |
| 8 | 2.879 | 84 |
| 10 | 1.159 | 5 |
| 12 | 1.368 | 11 |
| 16 | 1.485 | 155 |
| 18 | 1.012 | 9 |
| 24 | 1.445 | 2 |
| 26 | 1.747 | 1 |
| 28 | 1.004 | 2 |
| 32 | 1.118 | 224 |
| 34 | 1.008 | 3 |
| 36 | 1.015 | 5 |
| 40 | 1.006 | 1 |
| 42 | 1 | 2 |
| 50 | 1.901 | 1 |
| 52 | 1.02 | 1 |
| 64 | 2.433 | 279 |
| 66 | 1.013 | 12 |
| 82 | 1.002 | 1 |
| 84 | 1.004 | 1 |
| 96 | 1.13 | 16 |
| 98 | 1.024 | 68 |
| 100 | 1.958 | 3 |
| 122 | 1.003 | 11 |
| 124 | 1.014 | 3 |
| 128 | 2.156 | 316 |
| 130 | 1.029 | 15 |
| 132 | 1.008 | 5 |
| 160 | 1.004 | 3 |
| 162 | 1.025 | 8 |
| 176 | 1.096 | 13 |
| 192 | 1.003 | 7 |
| 194 | 1.024 | 20 |
| 222 | 1.032 | 24 |
| 226 | 1.061 | 2 |
| 242 | 1.003 | 1 |
| 254 | 1.006 | 20 |
| 256 | 2.456 | 179 |
| 258 | 1.038 | 1 |
| 260 | 1.074 | 1 |
| 264 | 1.043 | 22 |
| 272 | 1.024 | 1 |
| 276 | 1.001 | 2 |
| 290 | 1.051 | 1 |
| 336 | 1.013 | 1 |
| 376 | 1.062 | 1 |
| 384 | 1.058 | 15 |
| 396 | 1.579 | 20 |
| 400 | 1.031 | 8 |
| 512 | 3.761 | 157 |
| 516 | 3.024 | 2 |
| 520 | 1.054 | 3 |
| 528 | 1.238 | 1 |
| 768 | 1.466 | 89 |
| 772 | 1.355 | 1 |
| 826 | 1.701 | 3 |
| 990 | 1.001 | 3 |
| 1024 | 1.365 | 55 |
| 1028 | 11.826 | 3 |
| 1032 | 1.007 | 3 |
| 1040 | 1.018 | 1 |
| 1544 | 1.034 | 1 |
| 2048 | 2.46 | 119 |
| 2052 | 1.012 | 1 |
| 2056 | 1.509 | 39 |
| 2064 | 1.035 | 3 |
| 2896 | 1.013 | 1 |
| 3656 | 1.013 | 1 |
| 4008 | 1.105 | 8 |
| 4012 | 1.036 | 1 |
| 4096 | 14.302 | 14 |
| 8192 | 90.085 | 5 |
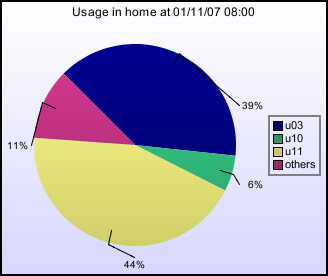
| Project | Usage(Gb) | Quota(Gb) |
|---|---|---|
| e42 | 1 | 100 |
| n01 | 3 | 100 |
| n02 | 1 | 200 |
| n03 | 1 | 110 |
| n04 | 1 | 200 |
| u01 | 20 | 201 |
| u02 | 2 | 99 |
| u03 | 365 | 500 |
| u04 | 28 | 200 |
| u05 | 2 | 200 |
| u06 | 16 | 100 |
| u07 | 3 | 100 |
| u08 | 3 | 200 |
| u09 | 1 | 200 |
| u10 | 54 | 100 |
| u11 | 407 | 500 |
| y08 | 1 | 100 |
| z01 | 20 | 100 |
| z03 | 14 | 99 |
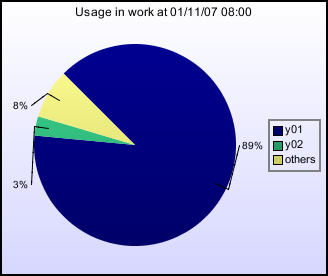
| Project | Usage(Gb) | Quota(Gb) | Files(Files) |
|---|---|---|---|
| e42 | 24 | 400 | 30,648 |
| n01 | 159 | 3,000 | 1,495 |
| n02 | 69 | 100 | 67,186 |
| n03 | 70 | 108 | 7,155 |
| n04 | 1 | 100 | 3 |
| u01 | 14 | 400 | 4,668 |
| u02 | 9 | 200 | 1,629 |
| u03 | 937 | 2,048 | 922,940 |
| u04 | 27 | 399 | 523 |
| u05 | 143 | 900 | 6,819 |
| u06 | 185 | 199 | 2,498 |
| u08 | 109 | 400 | 38,821 |
| u09 | 362 | 400 | 15,431 |
| u10 | 290 | 400 | 81,840 |
| u11 | 156 | 200 | 4,391 |
| y01 | 32,835 | 2,267,156 | |
| y02 | 1,140 | 331,043 | |
| y05 | 10 | 6,844 | |
| y07 | 1 | 2 | |
| y08 | 1 | 100 | 3 |
| y09 | 1 | 1,674 | |
| z01 | 159 | 200 | 87,883 |
| z02 | 11 | 200 | 71 |
| z03 | 197 | 1,024 | 2,681 |
Note: The 32Tb of data in y01 project were part of the acceptance testing and will be removed shortly.

A total of 272 queries with a specified service metric were completed in this period. There were 24 queries without a metric completed in the same period.
| Metric | Pass | Total | Fraction | Target |
|---|---|---|---|---|
| All queries finished in 1 day | 218 | 223 | 98% | 97% |
| Admin queries finished in 1 day | 184 | 189 | 97% | 97% |
| Queries assigned in 30 min | 271 | 272 | 99.6% | 97% |
| Technical assessments in 10 days | 20 | 21 | 95% | 97% |
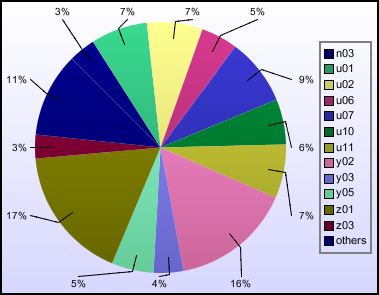
| Project | Queries | Percentage |
|---|---|---|
| y03 | 26 | 12.4% |
| n03 | 21 | 10.0% |
| n02 | 18 | 8.6% |
| n01 | 15 | 7.1% |
| z01 | 14 | 6.7% |
| e42 | 13 | 6.2% |
| y01 | 12 | 5.7% |
| z03 | 10 | 4.8% |
| y07 | 10 | 4.8% |
| u10 | 10 | 4.8% |
| y05 | 8 | 3.8% |
| y02 | 6 | 2.9% |
| u11 | 6 | 2.9% |
| u05 | 6 | 2.9% |
| u03 | 6 | 2.9% |
| z02 | 5 | 2.4% |
| u01 | 4 | 1.9% |
| y09 | 3 | 1.4% |
| u04 | 3 | 1.4% |
| n04 | 3 | 1.4% |
| z04 | 2 | 1.0% |
| y06 | 2 | 1.0% |
| u08 | 2 | 1.0% |
| u07 | 2 | 1.0% |
| u02 | 2 | 1.0% |
| u06 | 1 | 0.5% |
| Service Metric | Queries | Percentage |
|---|---|---|
| Automatic | 145 | 53.3% |
| Admin | 44 | 16.2% |
| Technical | 34 | 12.5% |
| In-depth | 28 | 10.3% |
| Technical assessment | 21 | 7.7% |
| Query Category | Queries | Percentage |
|---|---|---|
| New User | 58 | 21.3% |
| Access to HECToR | 33 | 12.1% |
| Set group quotas | 25 | 9.2% |
| New Password | 24 | 8.8% |
| None | 22 | 8.1% |
| Disk, tapes, resources | 19 | 7% |
| Join Project | 17 | 6.2% |
| New Group | 13 | 4.8% |
| Login, passwords and ssh | 11 | 4% |
| Courses | 7 | 2.6% |
| Compilers and system software | 7 | 2.6% |
| 3rd Party Software | 7 | 2.6% |
| Batch system and queues | 6 | 2.2% |
| Add to group | 6 | 2.2% |
| Set user quotas | 5 | 1.8% |
| Other | 5 | 1.8% |
| User programs | 2 | 0.7% |
| Static website | 1 | 0.4% |
| SAFE | 1 | 0.4% |
| Remove account | 1 | 0.4% |
| Performance and scaling | 1 | 0.4% |
| Network | 1 | 0.4% |
| Handlers | Total | In-depth | Automatic | Admin | Technical assessment | Technical | Percentage |
|---|---|---|---|---|---|---|---|
| CSE | 28 | 6 | 20 | 2 | 10.3% | ||
| OSG | 180 | 13 | 145 | 6 | 16 | 66.2% | |
| USL | 53 | 7 | 35 | 1 | 10 | 19.5% | |
| Other | 3 | 3 | 1.1% | ||||
| Cray Systems | 8 | 2 | 6 | 2.9% |
| Date | Value | Comment |
| Oct 15, 2007 6:26:07 PM | * * * * |
| HECToR Admin FAQ | Questions about SAFE | SAFE is an EPCC product |